TCF Bank 2007 Annual Report Download - page 96
Download and view the complete annual report
Please find page 96 of the 2007 TCF Bank annual report below. You can navigate through the pages in the report by either clicking on the pages listed below, or by using the keyword search tool below to find specific information within the annual report.-
 1
1 -
2
-
3
-
4
-
5
-
6
-
7
-
8
-
9
-
10
-
11
-
12
-
13
-
14
-
15
-
16
-
17
-
18
-
19
-
20
-
21
-
22
-
23
-
24
-
25
-
26
-
27
-
28
-
29
-
30
-
31
-
32
-
33
-
34
-
35
-
36
-
37
-
38
-
39
-
40
-
41
-
42
-
43
-
44
-
45
-
46
-
47
-
48
-
49
-
50
-
51
-
52
-
53
-
54
-
55
-
56
-
57
-
58
-
59
-
60
-
61
-
62
-
63
-
64
-
65
-
66
-
67
-
68
-
69
-
70
-
71
-
72
-
73
-
74
-
75
-
76
-
77
-
78
-
79
-
80
-
81
-
82
-
83
-
84
-
85
-
 86
86 -
 87
87 -
 88
88 -
 89
89 -
 90
90 -
 91
91 -
 92
92 -
 93
93 -
 94
94 -
 95
95 -
 96
96 -
 97
97 -
 98
98 -
 99
99 -
 100
100 -
 101
101 -
 102
102 -
 103
103 -
 104
104 -
 105
105 -
 106
106 -
107
-
108
-
109
-
110
-
111
-
112
-
113
-
114
 |
 |

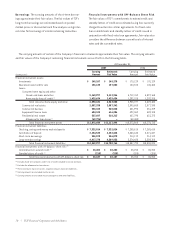
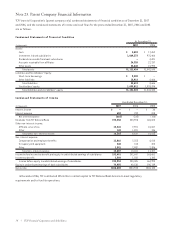
76 | TCF Financial Corporation and Subsidiaries
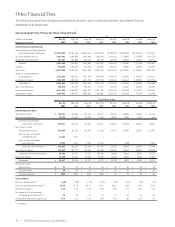
Other Financial Data
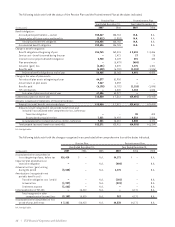
The selected quarterly financial data presented below should be read in conjunction with the Consolidated Financial
Statements and related notes.
Selected Quarterly Financial Data (Unaudited) At
(Dollars in thousands, Dec. 31, Sept. 30, June 30, March 31, Dec. 31, Sept. 30, June 30, March 31,
except per-share data) 2007 2007 2007 2007 2006 2006 2006 2006
Selected Financial Condition Data:
Loans and leases excluding education
and residential real estate loans $11,810,629 $11,334,162 $11,038,605 $10,815,212 $10,705,890 $10,496,031 $10,231,268 $ 9,824,661
Securities available for sale 1,963,681 2,022,505 1,943,450 1,859,244 1,816,126 1,770,427 1,781,995 1,816,135
Residential real estate loans 527,607 547,552 572,619 602,748 627,790 659,477 695,214 732,912
Subtotal 2,491,288 2,570,057 2,516,069 2,461,992 2,443,916 2,429,904 2,477,209 2,549,047
Goodwill 152,599 152,599 152,599 152,599 152,599 152,599 152,599 152,599
Total assets 15,977,054 15,530,338 14,977,704 14,898,375 14,669,734 14,319,387 14,222,561 13,851,936
Checking, savings and money
market deposits 7,322,014 7,312,568 7,331,605 7,420,480 7,285,615 7,224,223 7,261,327 7,461,186
Certificates of deposit 2,254,535 2,433,498 2,511,090 2,477,230 2,483,635 2,454,469 2,382,273 2,128,723
Total deposits 9,576,549 9,746,066 9,842,695 9,897,710 9,769,250 9,678,692 9,643,600 9,589,909
Short-term borrowings 556,070 167,319 285,828 47,376 214,112 376,397 561,374 346,528
Long-term borrowings 4,417,378 4,266,022 3,568,997 3,571,930 3,374,428 2,976,133 2,778,277 2,688,131
Stockholders’ equity 1,099,012 1,043,447 1,001,032 1,062,008 1,033,374 1,031,189 977,385 968,300
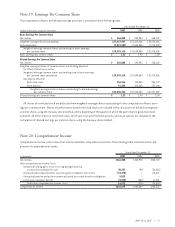
Three Months Ended
Dec. 31, Sept. 30, June 30, March 31, Dec. 31, Sept. 30, June 30, March 31,
2007 2007 2007 2007 2006 2006 2006 2006
Selected Operations Data:
Net interest income $ 139,571 $ 137,704 $ 137,425 $ 135,477 $ 135,887 $ 135,033 $ 135,442 $ 131,168
Provision for credit losses 20,124 18,883 13,329 4,656 10,073 5,288 4,177 1,151
Net interest income after
provision for credit losses 119,447 118,821 124,096 130,821 125,814 129,745 131,265 130,017
Non-interest income:
Fees and other revenue 124,845 126,394 126,882 112,164 118,831 128,252 123,622 114,571
Gains on sales of securities
available for sale 11,261 2,017 ––––––
Gains on sales of branches
and real estate 2,752 1,246 2,723 31,173 – 1,260 – 2,928
Total non-interest income 138,858 129,657 129,605 143,337 118,831 129,512 123,622 117,499
Non-interest expense 172,613 162,777 162,534 164,200 165,562 162,389 160,966 160,280
Income before income tax expense 85,692 85,701 91,167 109,958 79,083 96,868 93,921 87,236
Income tax expense 22,875 26,563 29,038 27,234 25,350 30,941 26,860 29,014
Net income $ 62,817 $ 59,138 $ 62,129 $ 82,724 $ 53,733 $ 65,927 $ 67,061 $ 58,222
Per common share:
Basic earnings $ .51 $ .48 $ .49 $ .65 $ .42 $ .51 $ .52 $ .45
Diluted earnings $ .50 $ .48 $ .49 $ .65 $ .42 $ .51 $ .52 $ .45
Dividends declared $ .2425 $ .2425 $ .2425 $ .2425 $ .23 $ .23 $ .23 $ .23
Financial Ratios:
Return on average assets (1) 1.60% 1.55% 1.67% 2.24% 1.49% 1.86% 1.92% 1.71%
Return on average common equity (1) 23.55 23.39 24.16 31.81 20.68 26.44 27.75 23.82
Net interest margin (1) 3.83 3.90 4.02 4.00 4.07 4.11 4.22 4.25
Net charge-offs as a percentage
of average loans and leases (1) .46 .38 .24 .10 .24 .18 .16 .08
Average total equity to average assets 6.79 6.64 6.92 7.03 7.20 7.02 6.92 7.18
(1) Annualized.