TCF Bank 2007 Annual Report Download - page 95
Download and view the complete annual report
Please find page 95 of the 2007 TCF Bank annual report below. You can navigate through the pages in the report by either clicking on the pages listed below, or by using the keyword search tool below to find specific information within the annual report.-
 1
1 -
2
-
3
-
4
-
5
-
6
-
7
-
8
-
9
-
10
-
11
-
12
-
13
-
14
-
15
-
16
-
17
-
18
-
19
-
20
-
21
-
22
-
23
-
24
-
25
-
26
-
27
-
28
-
29
-
30
-
31
-
32
-
33
-
34
-
35
-
36
-
37
-
38
-
39
-
40
-
41
-
42
-
43
-
44
-
45
-
46
-
47
-
48
-
49
-
50
-
51
-
52
-
53
-
54
-
55
-
56
-
57
-
58
-
59
-
60
-
61
-
62
-
63
-
64
-
65
-
66
-
67
-
68
-
69
-
70
-
71
-
72
-
73
-
74
-
75
-
76
-
77
-
78
-
79
-
80
-
81
-
82
-
83
-
84
-
 85
85 -
 86
86 -
 87
87 -
 88
88 -
 89
89 -
 90
90 -
 91
91 -
 92
92 -
 93
93 -
 94
94 -
 95
95 -
 96
96 -
 97
97 -
 98
98 -
 99
99 -
 100
100 -
 101
101 -
 102
102 -
 103
103 -
 104
104 -
 105
105 -
106
-
107
-
108
-
109
-
110
-
111
-
112
-
113
-
114
 |
 |

2007 Form 10-K | 752007 Form 10-K | 75
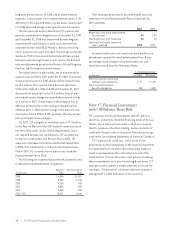
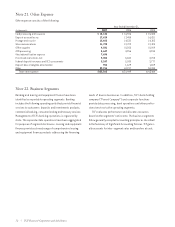
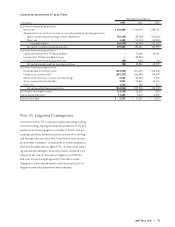
Condensed Statements of Cash Flows
Year Ended December 31,
(In thousands) 2007 2006 2005
Cash flows from operating activities:
Net income $ 266,808 $ 244,943 $ 265,132
Adjustments to reconcile net income to net cash provided by operating activities:
Equity in undistributed earnings of bank subsidiaries (68,163) (33,229) (107,548)
Other, net 1,188 (18,713) (13,594)
Total adjustments (66,975) (51,942) (121,142)
Net cash provided by operating activities 199,833 193,001 143,990
Cash flows from investing activities:
Capital distribution from TCF National Bank –75,000 50,000
Investment in TCF National Bank Arizona –(35,000) –
Purchases of premises and equipment, net (88) (104) (28)
Net cash provided (used) by investing activities (88) 39,896 49,972
Cash flows from financing activities:
Dividends paid on common stock (124,513) (121,405) (114,543)
Purchases of common stock (105,251) (101,045) (93,499)
Net increase (decrease) in short-term borrowings 9,500 (16,500) 2,500
Stock compensation tax benefits 4,534 20,681 10,716
Other, net 1,216 354 577
Net cash used by financing activities (214,514) (217,915) (194,249)
Net increase (decrease) in cash (14,769) 14,982 (287)
Cash at beginning of year 17,652 2,670 2,957
Cash at end of year $ 2,883 $ 17,652 $ 2,670
Note 24. Litigation Contingencies
From time to time, TCF is a party to legal proceedings arising
out of its lending, leasing and deposit operations. TCF is and
expects to become engaged in a number of foreclosure pro-
ceedings and other collection actions as part of its lending
and leasing collection activities. From time to time, borrow-
ers and other customers, or employees or former employees,
have also brought actions against TCF, in some cases claim-
ing substantial damages. Financial services companies are
subject to the risk of class action litigation, and TCF has
had such actions brought against it from time to time.
Litigation is often unpredictable and the actual results of
litigation cannot be determined with certainty.