TCF Bank 2007 Annual Report Download - page 2
Download and view the complete annual report
Please find page 2 of the 2007 TCF Bank annual report below. You can navigate through the pages in the report by either clicking on the pages listed below, or by using the keyword search tool below to find specific information within the annual report.-
 1
1 -
 2
2 -
 3
3 -
 4
4 -
 5
5 -
 6
6 -
 7
7 -
 8
8 -
 9
9 -
 10
10 -
 11
11 -
 12
12 -
 13
13 -
14
-
15
-
16
-
17
-
18
-
19
-
20
-
21
-
22
-
23
-
24
-
25
-
26
-
27
-
28
-
29
-
30
-
31
-
32
-
33
-
34
-
35
-
36
-
37
-
38
-
39
-
40
-
41
-
42
-
43
-
44
-
45
-
46
-
47
-
48
-
49
-
50
-
51
-
52
-
53
-
54
-
55
-
56
-
57
-
58
-
59
-
60
-
61
-
62
-
63
-
64
-
65
-
66
-
67
-
68
-
69
-
70
-
71
-
72
-
73
-
74
-
75
-
76
-
77
-
78
-
79
-
80
-
81
-
82
-
83
-
84
-
85
-
86
-
87
-
88
-
89
-
90
-
91
-
92
-
93
-
94
-
95
-
96
-
97
-
98
-
99
-
100
-
101
-
102
-
103
-
104
-
105
-
106
-
107
-
108
-
109
-
110
-
111
-
112
-
113
-
114
 |
 |

TCF Financial Corporation and Subsidiaries Financial Highlights
At or For the Year Ended December 31,
(Dollars in thousands, except per-share data) 2007 2006 % Change
Operating Results:
Net interest income $550,177 $537,530 2.4%
Provision for credit losses 56,992 20,689 175.5
Net interest income after provision for credit losses 493,185 516,841 (4.6)
Non-interest income:
Fees and other revenue 490,285 485,276 1.0
Gains on sales of securities available for sale 13,278 – N.M.
Gains on sales of branches and real estate 37,894 4,188 N.M.
Total non-interest income 541,457 489,464 10.6
Non-interest expense 662,124 649,197 2.0
Income before income tax expense 372,518 357,108 4.3
Income tax expense 105,710 112,165 (5.8)
Net income $266,808 $244,943 8.9
Per Common Share Information:
Basic earnings $ 2.13 $ 1.90 12.1%
Diluted earnings 2.12 1.90 11.6
Dividends declared .97 .92 5.4
Stock price:
High 28.99 28.41
Low 17.17 24.23
Close 17.93 27.42 (34.6)
Book value 8.68 7.92 9.6
Price to book value 2.07 X 3.46 X (40.2)
Financial Ratios:
Return on average assets 1.76% 1.74% 1.1
Return on average common equity 25.82 24.37 5.9
Net interest margin 3.94 4.16 (5.3)
Net charge-offs as a percentage of average loans and leases .30 .17 76.5
Total equity to total assets at year end 6.88 7.04 (2.3)
N.M. Not Meaningful.
Financial Highlights
Table of Contents
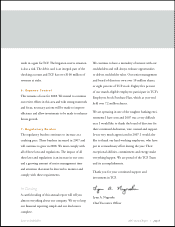
1 Letter to Our Stockholders
10 Business Highlights
Annual Report on Form 10-K
1 Business
16 Selected Financial Data
17 Management’s Discussion and Analysis
45 Consolidated Financial Statements
49 Notes to Consolidated Financial Statements
76 Other Financial Data
89 Corporate Information
91 Stockholder Information
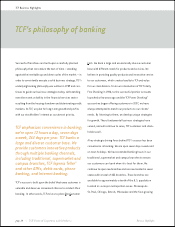
93 Corporate Philosophy