TCF Bank 2007 Annual Report Download - page 74
Download and view the complete annual report
Please find page 74 of the 2007 TCF Bank annual report below. You can navigate through the pages in the report by either clicking on the pages listed below, or by using the keyword search tool below to find specific information within the annual report.-
 1
1 -
2
-
3
-
4
-
5
-
6
-
7
-
8
-
9
-
10
-
11
-
12
-
13
-
14
-
15
-
16
-
17
-
18
-
19
-
20
-
21
-
22
-
23
-
24
-
25
-
26
-
27
-
28
-
29
-
30
-
31
-
32
-
33
-
34
-
35
-
36
-
37
-
38
-
39
-
40
-
41
-
42
-
43
-
44
-
45
-
46
-
47
-
48
-
49
-
50
-
51
-
52
-
53
-
54
-
55
-
56
-
57
-
58
-
59
-
60
-
61
-
62
-
63
-
 64
64 -
 65
65 -
 66
66 -
 67
67 -
 68
68 -
 69
69 -
 70
70 -
 71
71 -
 72
72 -
 73
73 -
 74
74 -
 75
75 -
 76
76 -
 77
77 -
 78
78 -
 79
79 -
 80
80 -
 81
81 -
 82
82 -
 83
83 -
 84
84 -
85
-
86
-
87
-
88
-
89
-
90
-
91
-
92
-
93
-
94
-
95
-
96
-
97
-
98
-
99
-
100
-
101
-
102
-
103
-
104
-
105
-
106
-
107
-
108
-
109
-
110
-
111
-
112
-
113
-
114
 |
 |

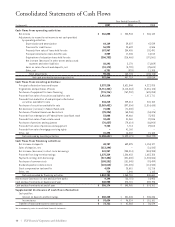
54 | TCF Financial Corporation and Subsidiaries
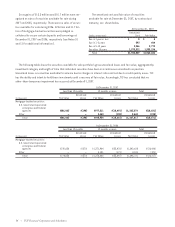
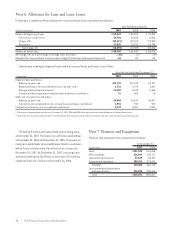
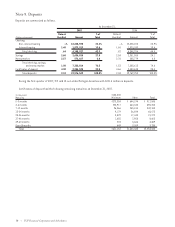
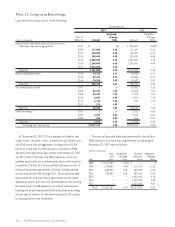
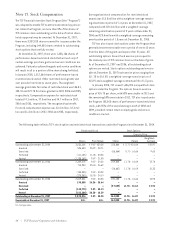
The following table shows the securities available for sale portfolio’s gross unrealized losses and fair value, aggregated by
investment category and length of time that individual securities have been in a continuous unrealized loss position.
Unrealized losses on securities available for sale are due to changes in interest rates and not due to credit quality issues. TCF
has the ability and intent to hold these investments until a recovery of fair value. Accordingly, TCF has concluded that no
other-than-temporary impairment has occurred at December 31, 2007.
At December 31, 2007
Less than 12 months 12 months or more Total
Unrealized Unrealized Unrealized
(In thousands) Fair Value Losses Fair Value Losses Fair Value Losses
Mortgage-backed securities:
U.S. Government sponsored
enterprises and federal
agencies $286,063 $(190) $977,511 $(18,491) $1,263,574 $(18,681)
Other – – 3,443 (190) 3,443 (190)
Total $286,063 $(190) $980,954 $(18,681) $1,267,017 $(18,871)
At December 31, 2006
Less than 12 months 12 months or more Total
Unrealized Unrealized Unrealized
(In thousands) Fair Value Losses Fair Value Losses Fair Value Losses
Mortgage-backed securities:
U.S. Government sponsored
enterprises and federal
agencies $270,636 $(570) $1,271,984 $(33,476) $1,542,620 $(34,046)
Other – – 4,101 (171) 4,101 (171)
Total $270,636 $(570) $1,276,085 $(33,647) $1,546,721 $(34,217)
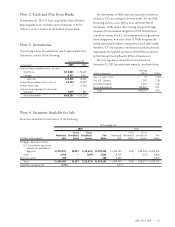
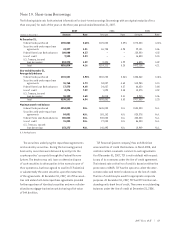
Gross gains of $13.3 million and $10.7 million were rec-
ognized on sales of securities available for sale during
2007 and 2005, respectively. There were no sales of securi-
ties available for sale during 2006. $2 billion and $1.7 bil-
lion of mortgage-backed securities were pledged as
collateral to secure certain deposits and borrowings at
December 31, 2007 and 2006, respectively (see Notes 10
and 11 for additional information).
The amortized cost and fair value of securities
available for sale at December 31, 2007, by contractual
maturity, are shown below.
At December 31, 2007
Amortized
(Dollars in thousands) Cost Fair Value
Due in 1 year or less $ 8 $ 8
Due in 1-5 years 593 604
Due in 5-10 years 3,946 3,773
Due after 10 years 1,975,512 1,959,296
Total $1,980,059 $1,963,681