TCF Bank 2007 Annual Report Download - page 42
Download and view the complete annual report
Please find page 42 of the 2007 TCF Bank annual report below. You can navigate through the pages in the report by either clicking on the pages listed below, or by using the keyword search tool below to find specific information within the annual report.-
 1
1 -
2
-
3
-
4
-
5
-
6
-
7
-
8
-
9
-
10
-
11
-
12
-
13
-
14
-
15
-
16
-
17
-
18
-
19
-
20
-
21
-
22
-
23
-
24
-
25
-
26
-
27
-
28
-
29
-
30
-
31
-
 32
32 -
 33
33 -
 34
34 -
 35
35 -
 36
36 -
 37
37 -
 38
38 -
 39
39 -
 40
40 -
 41
41 -
 42
42 -
 43
43 -
 44
44 -
 45
45 -
 46
46 -
 47
47 -
 48
48 -
 49
49 -
 50
50 -
 51
51 -
 52
52 -
53
-
54
-
55
-
56
-
57
-
58
-
59
-
60
-
61
-
62
-
63
-
64
-
65
-
66
-
67
-
68
-
69
-
70
-
71
-
72
-
73
-
74
-
75
-
76
-
77
-
78
-
79
-
80
-
81
-
82
-
83
-
84
-
85
-
86
-
87
-
88
-
89
-
90
-
91
-
92
-
93
-
94
-
95
-
96
-
97
-
98
-
99
-
100
-
101
-
102
-
103
-
104
-
105
-
106
-
107
-
108
-
109
-
110
-
111
-
112
-
113
-
114
 |
 |

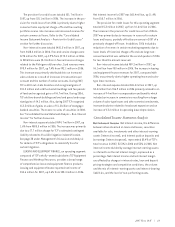
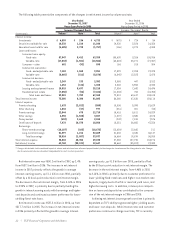
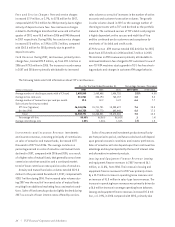
Net interest income was $550.2 million for 2007, up 2.4%
from $537.5 million in 2006. The increase in net interest
income in 2007 primarily reflects the growth in average
interest-earning assets, up $1.1 billion over 2006, partially
offset by a 22 basis point reduction in net interest margin.
The decrease in the net interest margin, from 4.16% in 2006
to 3.94% in 2007, is primarily due to partially funding the
growth in interest earning assets with borrowings and higher-
cost deposits and continued customer preference for lower-
yielding fixed-rate loans.
Net interest income was $537.5 million in 2006, up from
$517.7 million in 2005. The increase in net interest income
in 2006 primarily reflected the growth in average interest
earning assets, up $1.3 billion over 2005, partially offset
by the 30 basis point reduction in net interest margin. The
decrease in the net interest margin, from 4.46% in 2005
to 4.16% in 2006 is primarily due to customer preference for
lower-yielding fixed-rate loans and higher-cost market-rate
deposits, largely due to the flat or inverted yield curve, and
higher borrowing costs. In addition, intense price competi-
tion on loans and deposits has contributed to the compres-
sion of the net interest margin in 2006 and 2005.
Achieving net interest income growth over time is primarily
dependent on TCF’s ability to generate higher-yielding assets
and lower-cost deposits. While interest rates and customer
preferences continue to change over time, TCF is currently
22 | TCF Financial Corporation and Subsidiaries
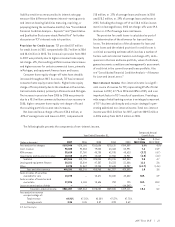
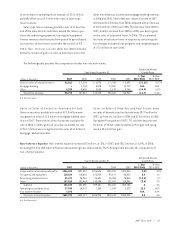
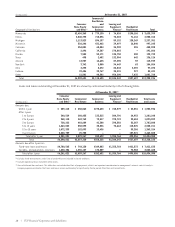
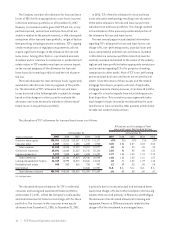
The following table presents the components of the changes in net interest income by volume and rate.
Year Ended Year Ended
December 31, 2007 December 31, 2006
Versus Same Period in 2006 Versus Same Period in 2005
Increase (Decrease) Due to Increase (Decrease) Due to
(In thousands) Volume(1) Rate(1) Total Volume(1) Rate(1) Total
Interest income:
Investments $ 4,599 $ 134 $ 4,733 $ (670) $ 724 $ 54
Securities available for sale 10,336 1,210 11,546 14,030 2,526 16,556
Education loans held for sale (4,485) 2,728 (1,757) (186) 4,274 4,088
Loans and leases:
Consumer home equity:
Fixed-rate 57,947 5,412 63,359 105,630 3,286 108,916
Variable-rate (17,033) (1,551) (18,584) (62,828) 35,271 (27,557)
Consumer – other 682 (92) 590 186 318 504
Commercial real estate:
Fixed- and adjustable-rate 7,183 1,868 9,051 17,592 2,283 19,875
Variable-rate (8,665) (211) (8,876) (6,845) 12,523 5,678
Commercial business:
Fixed- and adjustable-rate 2,249 133 2,382 3,065 447 3,512
Variable-rate 1,454 (126) 1,328 2,060 5,984 8,044
Leasing and equipment finance 19,518 5,697 25,215 17,054 7,642 24,696
Residential real estate (7,050) (52) (7,102) (11,004) 754 (10,250)
Total loans and leases 59,581 7,782 67,363 72,801 60,617 133,418
Total interest income 73,505 8,380 81,885 86,280 67,836 154,116
Interest expense:
Premier checking 1,633 (2,522) (889) 10,536 5,093 15,629
Other checking 1,034 (57) 977 (351) 301 (50)
Premier savings 12,044 675 12,719 18,418 5,611 24,029
Other savings 4,555 (1,528) 3,027 (1,207) 4,585 3,378
Money market (403) 2,668 2,265 (242) 7,818 7,576
Certificates of deposit 7,472 10,578 18,050 18,551 28,805 47,356
Borrowings:
Short-term borrowings (18,107) (565) (18,672) (12,654) 12,865 211
Long-term borrowings 51,397 1,212 52,609 31,802 4,345 36,147
Total borrowings 35,024 (1,087) 33,937 16,684 19,674 36,358
Total interest expense 28,884 40,354 69,238 27,080 107,196 134,276
Net interest income 42,768 (30,121) 12,647 55,662 (35,822) 19,840
(1) Changes attributable to the combined impact of volume and rate have been allocated proportionately to the change due to volume and the change due to rate. Changes
due to volume and rate are calculated independently for each line item presented.