TCF Bank 2007 Annual Report Download - page 68
Download and view the complete annual report
Please find page 68 of the 2007 TCF Bank annual report below. You can navigate through the pages in the report by either clicking on the pages listed below, or by using the keyword search tool below to find specific information within the annual report.-
 1
1 -
2
-
3
-
4
-
5
-
6
-
7
-
8
-
9
-
10
-
11
-
12
-
13
-
14
-
15
-
16
-
17
-
18
-
19
-
20
-
21
-
22
-
23
-
24
-
25
-
26
-
27
-
28
-
29
-
30
-
31
-
32
-
33
-
34
-
35
-
36
-
37
-
38
-
39
-
40
-
41
-
42
-
43
-
44
-
45
-
46
-
47
-
48
-
49
-
50
-
51
-
52
-
53
-
54
-
55
-
56
-
57
-
 58
58 -
 59
59 -
 60
60 -
 61
61 -
 62
62 -
 63
63 -
 64
64 -
 65
65 -
 66
66 -
 67
67 -
 68
68 -
 69
69 -
 70
70 -
 71
71 -
 72
72 -
 73
73 -
 74
74 -
 75
75 -
 76
76 -
 77
77 -
 78
78 -
79
-
80
-
81
-
82
-
83
-
84
-
85
-
86
-
87
-
88
-
89
-
90
-
91
-
92
-
93
-
94
-
95
-
96
-
97
-
98
-
99
-
100
-
101
-
102
-
103
-
104
-
105
-
106
-
107
-
108
-
109
-
110
-
111
-
112
-
113
-
114
 |
 |

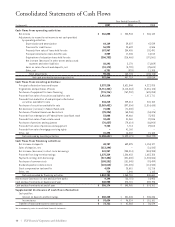
48 | TCF Financial Corporation and Subsidiaries
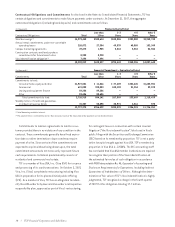
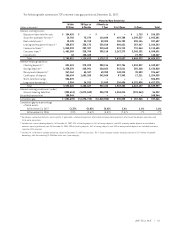
Consolidated Statements of Cash Flows
Year Ended December 31,
(In thousands) 2007 2006 2005
Cash flows from operating activities:
Net income $ 266,808 $ 244,943 $ 265,132
Adjustments to reconcile net income to net cash provided
by operating activities:
Depreciation and amortization 64,169 59,807 47,039
Provision for credit losses 56,992 20,689 8,586
Proceeds from sales of loans held for sale 187,967 284,455 102,491
Principal collected on loans held for sale 3,989 17,235 13,152
Originations of education loans held for sale (206,752) (216,468) (191,061)
Net increase (decrease) in other assets and accrued
expenses and other liabilities 28,292 3,176 (71,809)
Gains on sales of assets and deposits, net (51,172) (5,790) (25,624)
Other, net 6,751 (328) 11,108
Total adjustments 90,236 162,776 (106,118)
Net cash provided by operating activities 357,044 407,719 159,014
Cash flows from investing activities:
Principal collected on loans and leases 3,337,230 3,621,344 4,227,920
Originations and purchases of loans (3,711,353) (4,110,463) (4,551,188)
Purchases of equipment for lease financing (776,716) (767,932) (620,058)
Proceeds from sales of securities available for sale 1,916,424 – 1,017,711
Proceeds from maturities of and principal collected on
securities available for sale 234,215 229,014 247,152
Purchases of securities available for sale (2,369,452) (397,504) (1,314,638)
Net decrease (increase) in federal funds sold 71,000 (71,000) –
Purchases of Federal Home Loan Bank stock (95,226) (68,948) (53,876)
Proceeds from redemptions of Federal Home Loan Bank stock 53,008 49,466 75,952
Proceeds from sales of real estate owned 33,635 31,060 22,386
Purchases of premises and equipment (76,637) (79,614) (86,900)
Proceeds from sales of premises and equipment 9,743 7,714 29,604
Proceeds from sale of mortgage servicing rights –41,160 –
Other, net 15,498 16,532 21,163
Net cash used by investing activities (1,358,631) (1,499,171) (984,772)
Cash flows from financing activities:
Net increase in deposits 48,707 639,895 1,153,127
Sales of deposits, net (213,294) – (16,542)
Net increase (decrease) in short-term borrowings 341,957 (258,014) (583,985)
Proceeds from long-term borrowings 1,275,329 1,206,403 1,687,308
Payments on long-term borrowings (217,406) (321,830) (1,203,086)
Purchases of common stock (105,251) (101,045) (93,499)
Dividends paid on common stock (124,513) (121,405) (114,543)
Stock compensation tax benefits 4,534 20,681 10,716
Other, net 718 1,046 1,165
Net cash provided by financing activities 1,010,781 1,065,731 840,661
Net increase (decrease) in cash and due from banks 9,194 (25,721) 14,903
Cash and due from banks at beginning of year 348,980 374,701 359,798
Cash and due from banks at end of year $ 358,174 $ 348,980 $ 374,701
Supplemental disclosures of cash flow information:
Cash paid for:
Interest on deposits and borrowings $ 408,248 $ 331,345 $ 200,246
Income taxes $ 93,634 $ 96,324 $ 151,161
Transfer of loans and leases to other assets $ 73,733 $ 41,088 $ 26,574
See accompanying notes to consolidated financial statements.