TCF Bank 2007 Annual Report Download - page 55
Download and view the complete annual report
Please find page 55 of the 2007 TCF Bank annual report below. You can navigate through the pages in the report by either clicking on the pages listed below, or by using the keyword search tool below to find specific information within the annual report.-
 1
1 -
2
-
3
-
4
-
5
-
6
-
7
-
8
-
9
-
10
-
11
-
12
-
13
-
14
-
15
-
16
-
17
-
18
-
19
-
20
-
21
-
22
-
23
-
24
-
25
-
26
-
27
-
28
-
29
-
30
-
31
-
32
-
33
-
34
-
35
-
36
-
37
-
38
-
39
-
40
-
41
-
42
-
43
-
44
-
 45
45 -
 46
46 -
 47
47 -
 48
48 -
 49
49 -
 50
50 -
 51
51 -
 52
52 -
 53
53 -
 54
54 -
 55
55 -
 56
56 -
 57
57 -
 58
58 -
 59
59 -
 60
60 -
 61
61 -
 62
62 -
 63
63 -
 64
64 -
 65
65 -
66
-
67
-
68
-
69
-
70
-
71
-
72
-
73
-
74
-
75
-
76
-
77
-
78
-
79
-
80
-
81
-
82
-
83
-
84
-
85
-
86
-
87
-
88
-
89
-
90
-
91
-
92
-
93
-
94
-
95
-
96
-
97
-
98
-
99
-
100
-
101
-
102
-
103
-
104
-
105
-
106
-
107
-
108
-
109
-
110
-
111
-
112
-
113
-
114
 |
 |
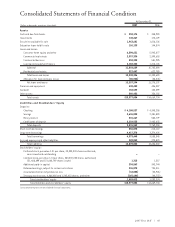
2007 Form 10-K | 35
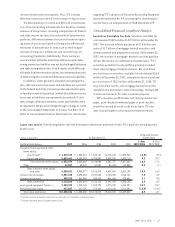
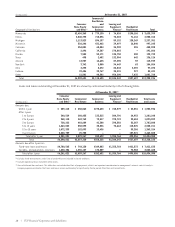
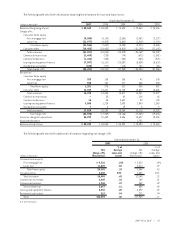
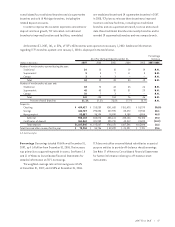
Past Due Loans and Leases The following table sets forth information regarding TCF’s delinquent loan and lease portfolio,
excluding loans held for sale and non-accrual loans and leases. TCF’s delinquency rates are determined based on the contrac-
tual terms of the loan or lease.
At December 31,
2007 2006
Percentage of Percentage of
Principal Loans and Principal Loans and
(Dollars in thousands) Balances Leases Balances Leases
Accruing loans and leases delinquent for:
30-59 days $46,748 .38% $34,607 .30%
60-89 days 20,445 .17 24,872 .22
90 days or more 15,384 .12 12,214 .11
Total $82,577 .67% $71,693 .63%
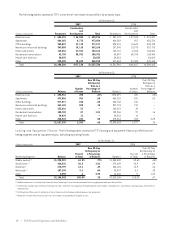
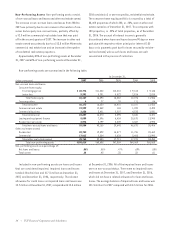
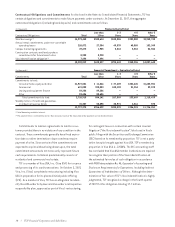
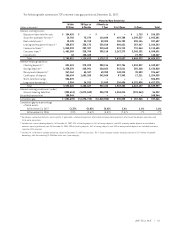
The following table summarizes TCF’s over 30-day delinquent loan and lease portfolio by loan type, excluding loans held for
sale and non-accrual loans and leases.
At December 31,
2007 2006
Principal Percentage of Principal Percentage of
(Dollars in thousands) Balances Portfolio Balances Portfolio
Consumer home equity
First mortgage lien $31,784 .76% $22,527 .60%
Junior lien 12,289 .53 11,406 .54
Total home equity 44,073 .68 33,933 .58
Consumer other 377 .56 380 .61
Total consumer 44,450 .68 34,313 .58
Commercial real estate 11,382 .45 18,072 .76
Commercial business 1,071 .19 762 .14
Total commercial 12,453 .40 18,834 .64
Leasing and equipment finance 15,691 .75 8,499 .47
Residential real estate 9,983 1.90 10,047 1.61
Total $82,577 .67 $71,693 .63
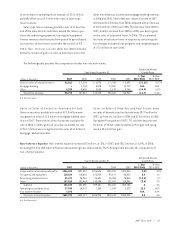
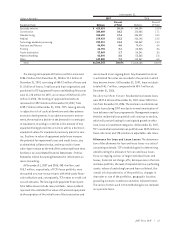
Potential Problem Loans and Leases In addition to
non-performing assets, there were $55.2 million of loans
and leases at December 31, 2007, for which management
has concerns regarding the ability of the borrowers to meet
existing repayment terms, compared with $66.1 million at
December 31, 2006. These loans and leases are primarily
classified as substandard for regulatory purposes and reflect
the distinct possibility, but not the probability, that the
Company will not be able to collect all amounts due accord-
ing to the contractual terms of the loan or lease agreement.
Although these loans and leases have been identified as
potential problem loans and leases, they may never become
delinquent, non-performing or impaired. Additionally, these
loans and leases are generally secured by commercial real
estate or other assets, thus reducing the potential for loss
should they become non-performing. Potential problem
loans and leases are considered in the determination of the
adequacy of the allowance for loan and lease losses. There
were no material leasing and equipment finance potential
problem loans at December 31, 2007, and 2006, respectively,
that were funded on a non-recourse basis.