TCF Bank 2007 Annual Report Download - page 36
Download and view the complete annual report
Please find page 36 of the 2007 TCF Bank annual report below. You can navigate through the pages in the report by either clicking on the pages listed below, or by using the keyword search tool below to find specific information within the annual report.-
 1
1 -
2
-
3
-
4
-
5
-
6
-
7
-
8
-
9
-
10
-
11
-
12
-
13
-
14
-
15
-
16
-
17
-
18
-
19
-
20
-
21
-
22
-
23
-
24
-
25
-
 26
26 -
 27
27 -
 28
28 -
 29
29 -
 30
30 -
 31
31 -
 32
32 -
 33
33 -
 34
34 -
 35
35 -
 36
36 -
 37
37 -
 38
38 -
 39
39 -
 40
40 -
 41
41 -
 42
42 -
 43
43 -
 44
44 -
 45
45 -
 46
46 -
47
-
48
-
49
-
50
-
51
-
52
-
53
-
54
-
55
-
56
-
57
-
58
-
59
-
60
-
61
-
62
-
63
-
64
-
65
-
66
-
67
-
68
-
69
-
70
-
71
-
72
-
73
-
74
-
75
-
76
-
77
-
78
-
79
-
80
-
81
-
82
-
83
-
84
-
85
-
86
-
87
-
88
-
89
-
90
-
91
-
92
-
93
-
94
-
95
-
96
-
97
-
98
-
99
-
100
-
101
-
102
-
103
-
104
-
105
-
106
-
107
-
108
-
109
-
110
-
111
-
112
-
113
-
114
 |
 |

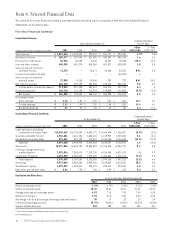
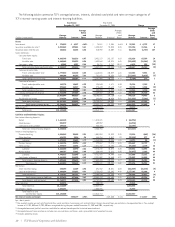
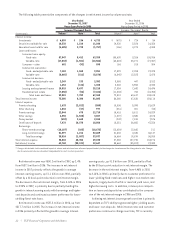
16 | TCF Financial Corporation and Subsidiaries
Five-Year Financial Summary
Consolidated Income: Compound Annual
Year Ended December 31, Growth Rate
1-Year 5-Year
(Dollars in thousands, except per-share data) 2007 2006 2005 2004 2003 2007/2006 2007/2002
Total revenue $ 1,091,634 $ 1,026,994 $ 995,932 $ 981,777 $ 900,256 6.3% 3.5%
Net interest income $ 550,177 $ 537,530 $ 517,690 $ 491,891 $ 481,145 2.4 2.0
Provision for credit losses 56,992 20,689 8,586 18,627 19,048 175.5 15.0
Fees and other revenue 490,285 485,276 453,965 467,027 429,899 1.0 3.8
Gains on sales of securities
available for sale 13,278 – 10,671 22,600 32,832 N.M. 2.9
Losses on termination of debt –– – – (44,345) ––
Gains on sales of branches
and real estate 37,894 4,188 13,606 259 725 N.M. 80.8
Non-interest expense 662,124 649,197 606,936 578,674 553,425 2.0 4.4
Income before income tax expense 372,518 357,108 380,410 384,476 327,783 4.3 .8
Income tax expense 105,710 112,165 115,278 129,483 111,905 (5.8) (3.3)
Net income $ 266,808 $ 244,943 $ 265,132 $ 254,993 $ 215,878 8.9 2.8
Per common share:
Basic earnings $ 2.13 $ 1.90 $ 2.00 $ 1.87 $ 1.53 12.1 6.2
Diluted earnings $ 2.12 $ 1.90 $ 2.00 $ 1.86 $ 1.53 11.6 6.1
Dividends declared $ .97 $ .92 $ .85 $ .75 $ .65 5.4 11.0
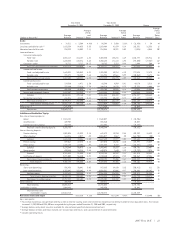
Consolidated Financial Condition: Compound Annual
At December 31, Growth Rate
1-Year 5-Year
(Dollars in thousands, except per share data) 2007 2006 2005 2004 2003 2007/2006 2007/2002
Loans and leases excluding
residential real estate loans $11,810,629 $10,705,890 $ 9,442,772 $ 8,404,404 $ 7,156,697 10.3% 13.2%
Securities available for sale 1,963,681 1,816,126 1,648,615 1,619,941 1,533,288 8.1 (4.1)
Residential real estate loans 527,607 627,790 770,441 1,014,166 1,212,643 (16.0) (21.8)
Subtotal 2,491,288 2,443,916 2,419,056 2,634,107 2,745,931 1.9 (10.0)
Total assets 15,977,054 14,669,734 13,388,594 12,376,965 11,344,737 8.9 5.5
Checking, savings and money
market deposits 7,322,014 7,285,615 7,213,735 6,525,458 6,021,189 .5 4.7
Certificates of deposit 2,254,535 2,483,635 1,915,620 1,468,650 1,612,123 (9.2) 3.3
Total deposits 9,576,549 9,769,250 9,129,355 7,994,108 7,633,312 (2.0) 4.4
Borrowings 4,973,448 3,588,540 2,983,136 3,104,603 2,414,825 38.6 9.8
Stockholders’ equity 1,099,012 1,033,374 998,472 958,418 920,858 6.4 2.4
Book value per common share $ 8.68 $ 7.92 $ 7.46 $ 6.99 $ 6.53 9.6 5.6
Key Ratios and Other Data: At or For the Year Ended December 31,
2007 2006 2005 2004 2003
Return on average assets 1.76% 1.74% 2.08% 2.15% 1.85%
Return on average equity 25.82 24.37 28.03 27.02 23.05
Average total equity to average assets 6.82 7.15 7.43 7.94 8.03
Net interest margin (1) 3.94 4.16 4.46 4.54 4.54
Net charge-offs as a percentage of average loans and leases .30 .17 .29 .20 .24
Common dividend payout ratio 45.75% 48.42% 42.50% 40.32% 42.48%
Number of bank branches 453 453 453 430 401
(1) Net interest income divided by average interest-earning assets.
N.M. Not Meaningful.
Item 6. Selected Financial Data
The selected five-year financial summary presented below should be read in conjunction with the Consolidated Financial
Statements and related notes.