TCF Bank 2007 Annual Report Download - page 45
Download and view the complete annual report
Please find page 45 of the 2007 TCF Bank annual report below. You can navigate through the pages in the report by either clicking on the pages listed below, or by using the keyword search tool below to find specific information within the annual report.-
 1
1 -
2
-
3
-
4
-
5
-
6
-
7
-
8
-
9
-
10
-
11
-
12
-
13
-
14
-
15
-
16
-
17
-
18
-
19
-
20
-
21
-
22
-
23
-
24
-
25
-
26
-
27
-
28
-
29
-
30
-
31
-
32
-
33
-
34
-
 35
35 -
 36
36 -
 37
37 -
 38
38 -
 39
39 -
 40
40 -
 41
41 -
 42
42 -
 43
43 -
 44
44 -
 45
45 -
 46
46 -
 47
47 -
 48
48 -
 49
49 -
 50
50 -
 51
51 -
 52
52 -
 53
53 -
 54
54 -
 55
55 -
56
-
57
-
58
-
59
-
60
-
61
-
62
-
63
-
64
-
65
-
66
-
67
-
68
-
69
-
70
-
71
-
72
-
73
-
74
-
75
-
76
-
77
-
78
-
79
-
80
-
81
-
82
-
83
-
84
-
85
-
86
-
87
-
88
-
89
-
90
-
91
-
92
-
93
-
94
-
95
-
96
-
97
-
98
-
99
-
100
-
101
-
102
-
103
-
104
-
105
-
106
-
107
-
108
-
109
-
110
-
111
-
112
-
113
-
114
 |
 |

2007 Form 10-K | 25
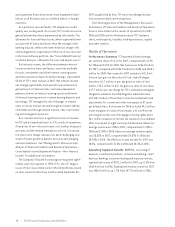
to an increase in operating lease revenues of $8.5 million,
partially offset by a $3.7 million decrease in sales-type
lease revenues.
Sales-type lease revenues generally occur at or near the
end of the lease term as customers extend the lease or pur-
chase the underlying equipment. Leasing and equipment
finance revenues may fluctuate from period to period based
on customer-driven factors not within the control of TCF.
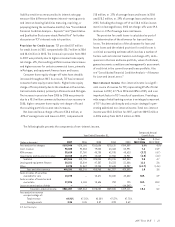
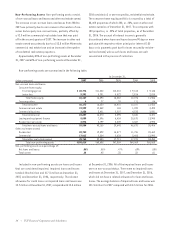
Other Non-Interest Income Other non-interest income
primarily consists of gains on sales of education loans and
other miscellaneous income and mortgage banking revenues
in 2006 and 2005. Total other non-interest income in 2007
decreased $13.3 million from 2006 compared with an increase
of $8.8 million in 2006 over 2005. The decrease from 2006 to
2007, and the increase from 2005 to 2006, was due to gains
on the sales of education loans. In 2006, TCF accelerated
the sales of education loans in response to certain legisla-
tive changes in student loan programs and recognized gains
of $7.2 million on such sales.
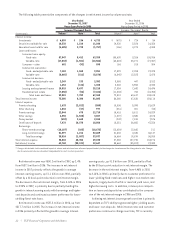
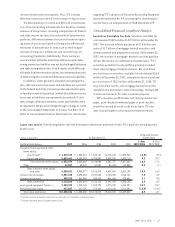
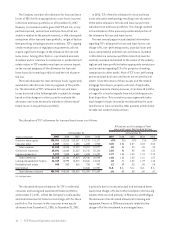
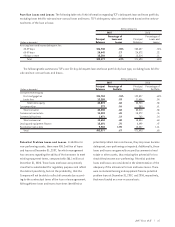
The following table presents the components of other non-interest income.
Compound Annual
Year Ended December 31, Growth Rate
1-Year 5-Year
(Dollars in thousands) 2007 2006 2005 2004 2003 2007/2006 2007/2002
Gains on sales of education loans $2,011 $ 7,224 $ 2,078 $ 7,789 $ 3,092 (72.2)% (5.7)%
Mortgage banking –4,734 5,578 12,960 12,719 N.M. N.M.
Other 6,259 9,609 5,088 1,879 3,146 (34.9) (6.0)
Total other earnings $8,270 $21,567 $12,744 $22,628 $18,957 (61.7) (14.6)
N.M. Not Meaningful.
Gains on Sales of Securities Available for Sale
Gains on securities available for sale of $13.3 million were
recognized on sales of $1.2 billion in mortgage-backed secu-
rities in 2007. There were no sales of securities available for
sale in 2006. In 2005, gains on securities available for sale
of $10.7 million were recognized on the sales of $1 billion in
mortgage-backed securities.
Gains on Sales of Branches and Real Estate Gains
on sales of branches and real estate were $37.9 million for
2007, up from $4.2 million in 2006 and $13.6 million in 2005.
During the first quarter of 2007, TCF sold the deposits and
facilities of 10 out-state branches in Michigan and recog-
nized a $31.2 million gain.
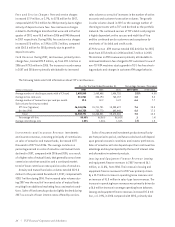
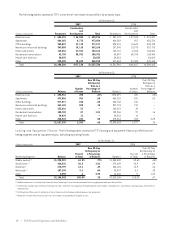
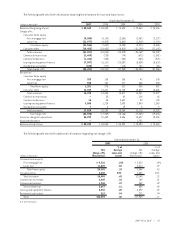
Non-Interest Expense Non-interest expense increased $2 million, or .3%, in 2007, and $35.2 million, or 5.9%, in 2006,
excluding the Visa USA indemnification and operating lease depreciation. The following table presents the components of
non-interest expense.
Compound Annual
Year Ended December 31, Growth Rate
1-Year 5-Year
(Dollars in thousands) 2007 2006 2005 2004 2003 2007/2006 2007/2002
Compensation and employee benefits $346,468 $341,857 $326,526 $322,824 $302,804 1.3% 3.3%
Occupancy and equipment 120,824 114,618 103,900 95,617 88,423 5.4 7.8
Advertising and promotions 21,679 26,926 25,691 26,353 25,536 (19.5) (.2)
Other 147,869 151,449 143,484 132,037 133,342 (2.4) 2.5
Subtotal 636,840 634,850 599,601 576,831 550,105 .3 3.8
Operating lease depreciation 17,588 14,347 7,335 1,843 3,320 22.6 40.3
Visa indemnification 7,696 –––– N.M. N.M.
Total non-interest expense $662,124 $649,197 $606,936 $578,674 $553,425 2.0 4.4
N.M. Not Meaningful.