TCF Bank 2007 Annual Report Download - page 41
Download and view the complete annual report
Please find page 41 of the 2007 TCF Bank annual report below. You can navigate through the pages in the report by either clicking on the pages listed below, or by using the keyword search tool below to find specific information within the annual report.-
 1
1 -
2
-
3
-
4
-
5
-
6
-
7
-
8
-
9
-
10
-
11
-
12
-
13
-
14
-
15
-
16
-
17
-
18
-
19
-
20
-
21
-
22
-
23
-
24
-
25
-
26
-
27
-
28
-
29
-
30
-
 31
31 -
 32
32 -
 33
33 -
 34
34 -
 35
35 -
 36
36 -
 37
37 -
 38
38 -
 39
39 -
 40
40 -
 41
41 -
 42
42 -
 43
43 -
 44
44 -
 45
45 -
 46
46 -
 47
47 -
 48
48 -
 49
49 -
 50
50 -
 51
51 -
52
-
53
-
54
-
55
-
56
-
57
-
58
-
59
-
60
-
61
-
62
-
63
-
64
-
65
-
66
-
67
-
68
-
69
-
70
-
71
-
72
-
73
-
74
-
75
-
76
-
77
-
78
-
79
-
80
-
81
-
82
-
83
-
84
-
85
-
86
-
87
-
88
-
89
-
90
-
91
-
92
-
93
-
94
-
95
-
96
-
97
-
98
-
99
-
100
-
101
-
102
-
103
-
104
-
105
-
106
-
107
-
108
-
109
-
110
-
111
-
112
-
113
-
114
 |
 |

2007 Form 10-K | 21
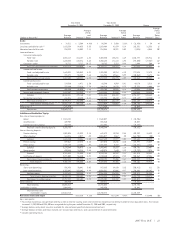
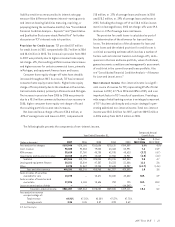
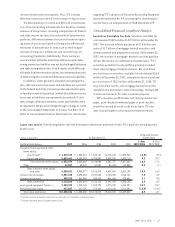
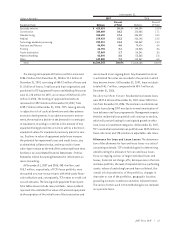
Year Ended Year Ended
December 31, 2006 December 31, 2005 Change
Average
Average Average Yields
Yields Yields and
Average and Average and Average Rates
(Dollars in thousands) Balance Interest(1) Rates Balance Interest(1) Rates Balance Interest(1) (bps)
Assets:
Investments $ 78,511 $ 3,504 4.46% $ 95,349 $ 3,450 3.62% $ (16,838) $ 54 84
Securities available for sale (2) 1,833,359 98,035 5.35 1,569,808 81,479 5.19 263,551 16,556 16
Education loans held for sale 210,992 15,009 7.11 214,588 10,921 5.09 (3,596) 4,088 202
Loans and leases:
Consumer home equity:
Fixed-rate 3,851,117 263,157 6.83 2,304,340 154,241 6.69 1,546,777 108,916 14
Variable-rate 1,659,544 143,576 8.65 2,450,634 171,133 6.98 (791,090) (27,557) 167
Consumer – other 36,711 3,717 10.13 34,763 3,213 9.24 1,948 504 89
Total consumer home equity and other 5,547,372 410,450 7.40 4,789,737 328,587 6.86 757,635 81,863 54
Commercial real estate:
Fixed- and adjustable-rate 1,665,531 105,089 6.31 1,385,905 85,214 6.15 279,626 19,875 16
Variable-rate 721,871 55,239 7.65 826,934 49,561 5.99 (105,063) 5,678 166
Total commercial real estate 2,387,402 160,328 6.72 2,212,839 134,775 6.09 174,563 25,553 63
Commercial business:
Fixed- and adjustable-rate 134,560 8,471 6.30 85,390 4,959 5.81 49,170 3,512 49
Variable-rate 373,690 27,619 7.39 340,314 19,575 5.75 33,376 8,044 164
Total commercial business 508,250 36,090 7.10 425,704 24,534 5.76 82,546 11,556 134
Leasing and equipment finance 1,659,807 122,292 7.37 1,423,264 97,596 6.86 236,543 24,696 51
Subtotal 10,102,831 729,160 7.22 8,851,544 585,492 6.61 1,251,287 143,668 61
Residential real estate 696,086 40,430 5.81 885,735 50,680 5.72 (189,649) (10,250) 9
Total loans and leases (3) 10,798,917 769,590 7.13 9,737,279 636,172 6.53 1,061,638 133,418 60
Total interest-earning assets 12,921,779 886,138 6.86 11,617,024 732,022 6.30 1,304,755 154,116 56
Other assets (4) 1,141,934 1,113,850 28,084
Total assets $14,063,713 $12,730,874 $1,332,839
Liabilities and Stockholders’ Equity:
Non-interest bearing deposits:
Retail $ 1,513,121 $ 1,548,027 $ (34,906)
Small business 609,907 585,860 24,047
Commercial and custodial 232,725 311,497 (78,772)
Total non-interest bearing deposits 2,355,753 2,445,384 (89,631)
Interest-bearing deposits:
Premier checking 1,001,024 31,539 3.15 641,672 15,910 2.48 359,352 15,629 67
Other checking 864,316 2,017 .23 1,026,017 2,067 .20 (161,701) (50) 3
Subtotal 1,865,340 33,556 1.80 1,667,689 17,977 1.08 197,651 15,579 72
Premier savings 899,067 37,275 4.15 427,070 13,246 3.10 471,997 24,029 105
Other savings 1,376,182 12,797 .93 1,558,423 9,419 .60 (182,241) 3,378 33
Subtotal 2,275,249 50,072 2.20 1,985,493 22,665 1.14 289,756 27,407 106
Money market 620,844 15,216 2.45 640,576 7,640 1.19 (19,732) 7,576 126
Subtotal 4,761,433 98,844 2.08 4,293,758 48,282 1.12 467,675 50,562 96
Certificates of deposit 2,291,002 96,480 4.21 1,740,440 49,124 2.82 550,562 47,356 139
Total interest-bearing deposits 7,052,435 195,324 2.77 6,034,198 97,406 1.61 1,018,237 97,918 116
Total deposits 9,408,188 195,324 2.08 8,479,582 97,406 1.15 928,606 97,918 93
Borrowings:
Short-term borrowings 596,852 30,041 5.03 917,665 29,830 3.25 (320,813) 211 178
Long-term borrowings 2,752,847 123,243 4.48 2,038,561 87,096 4.27 714,286 36,147 21
Total borrowings 3,349,699 153,284 4.58 2,956,226 116,926 3.96 393,473 36,358 62
Total interest-bearing liabilities 10,402,134 348,608 3.35 8,990,424 214,332 2.38 1,411,710 134,276 97
Total deposits and borrowings 12,757,887 348,608 2.73 11,435,808 214,332 1.87 1,322,079 134,276 86
Other liabilities 300,930 349,216 (48,286)
Total liabilities 13,058,817 11,785,024 1,273,793
Stockholders’ equity 1,004,896 945,850 59,046
Total liabilities and
stockholders’ equity $14,063,713 $12,730,874 $1,332,839
Net interest income and margin $537,530 4.16% $517,690 4.46% $ 19,840 (30)
bps = basis points.
(1) Tax-exempt income was not significant and thus yields on interest-earning assets and net interest margin have not been presented on a tax equivalent basis. Tax-exempt
income of $1,209,000 and $954,000 was recognized during the years ended December 31, 2006 and 2005, respectively.
(2) Average balance and yield of securities available for sale are based upon the historical amortized cost.
(3) Average balance of loans and leases includes non-accrual loans and leases, and is presented net of unearned income.
(4) Includes operating leases.