TCF Bank 2007 Annual Report Download - page 52
Download and view the complete annual report
Please find page 52 of the 2007 TCF Bank annual report below. You can navigate through the pages in the report by either clicking on the pages listed below, or by using the keyword search tool below to find specific information within the annual report.-
 1
1 -
2
-
3
-
4
-
5
-
6
-
7
-
8
-
9
-
10
-
11
-
12
-
13
-
14
-
15
-
16
-
17
-
18
-
19
-
20
-
21
-
22
-
23
-
24
-
25
-
26
-
27
-
28
-
29
-
30
-
31
-
32
-
33
-
34
-
35
-
36
-
37
-
38
-
39
-
40
-
41
-
 42
42 -
 43
43 -
 44
44 -
 45
45 -
 46
46 -
 47
47 -
 48
48 -
 49
49 -
 50
50 -
 51
51 -
 52
52 -
 53
53 -
 54
54 -
 55
55 -
 56
56 -
 57
57 -
 58
58 -
 59
59 -
 60
60 -
 61
61 -
 62
62 -
63
-
64
-
65
-
66
-
67
-
68
-
69
-
70
-
71
-
72
-
73
-
74
-
75
-
76
-
77
-
78
-
79
-
80
-
81
-
82
-
83
-
84
-
85
-
86
-
87
-
88
-
89
-
90
-
91
-
92
-
93
-
94
-
95
-
96
-
97
-
98
-
99
-
100
-
101
-
102
-
103
-
104
-
105
-
106
-
107
-
108
-
109
-
110
-
111
-
112
-
113
-
114
 |
 |

32 | TCF Financial Corporation and Subsidiaries
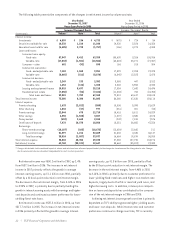
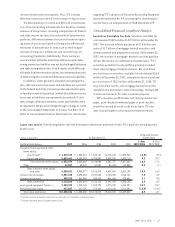
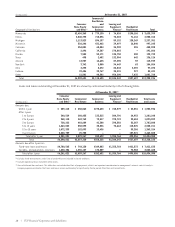
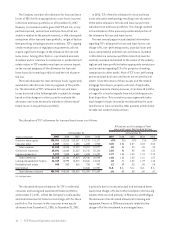
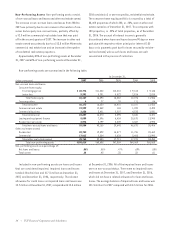
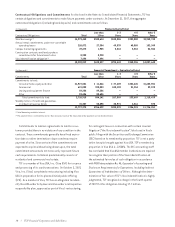
The allocation of TCF’s allowance for loan and lease losses is as follows.
Allocations as a Percentage of Total
Loans and Leases Outstanding by Type
At December 31, At December 31,
(Dollars in thousands) 2007 2006 2005 2004 2003 2007 2006 2005 2004 2003
Consumer home equity $30,951 $12,615 $10,017 $ 9,213 $ 8,177 .47% .21% .19% .21% .23%
Consumer other 2,059 2,211 2,053 1,694 1,900 3.05 3.54 3.57 3.02 3.04
Total consumer 33,010 14,826 12,070 10,907 10,077 .50 .25 .23 .25 .28
Commercial real estate 25,891 22,662 21,222 20,742 25,142 1.01 .95 .92 .96 1.31
Commercial business 7,077 7,503 6,602 7,696 11,797 1.27 1.36 1.52 1.76 2.75
Total commercial 32,968 30,165 27,824 28,438 36,939 1.06 1.03 1.02 1.10 1.57
Leasing and equipment finance 14,319 12,990 15,313 24,566 13,515 .68 .71 1.02 1.79 1.16
Residential real estate 645 562 616 796 942 .12 .09 .08 .08 .08
Unallocated –– – 10,686 10,987 N.A. N.A. N.A. N.A. N.A.
Total allowance balance $80,942 $58,543 $55,823 $75,393 $72,460 .66 .52 .55 .80 .87
N.A. Not Applicable.
The Company considers the allowance for loan and lease
losses of $80.9 million appropriate to cover losses incurred
in the loan and lease portfolios as of December 31, 2007.
However, no assurance can be given that TCF will not, in any
particular period, sustain loan and lease losses that are
sizable in relation to the amount reserved, or that subsequent
evaluations of the loan and lease portfolio, in light of factors
then prevailing, including economic conditions, TCF’s ongoing
credit review process or regulatory requirements, will not
require significant changes in the allowance for loan and
lease losses. Among other factors, a protracted economic
slowdown and/or a decline in commercial or residential real
estate values in TCF’s markets may have an adverse impact
on the current adequacy of the allowance for loan and
lease losses by increasing credit risk and the risk of poten-
tial loss.
The total allowance for loan and lease losses is generally
available to absorb losses from any segment of the portfo-
lio. The allocation of TCF’s allowance for loan and lease
losses disclosed in the following table is subject to change
based on the changes in criteria used to evaluate the
allowance and is not necessarily indicative of the trend of
future losses in any particular portfolio.
In 2005, TCF refined its allowance for loan and lease
losses allocation methodology resulting in an allocation
of the entire allowance for loan and lease losses to the
individual loan and lease portfolios. This change resulted
in the allocation of the previously unallocated portion of
the allowance for loan and lease losses.
The next several pages include detailed information
regarding TCF’s allowance for loan and lease losses, net
charge-offs, non-performing assets, past due loans and
leases and potential problem loans and leases. Included
in this data are numerous portfolio ratios that must be
carefully reviewed and related to the nature of the underly-
ing loan and lease portfolios before appropriate conclusions
can be reached regarding TCF or for purposes of making
comparisons to other banks. Most of TCF’s non-performing
assets and past due loans and leases are secured by real
estate. Given the nature of these assets and the related
mortgage foreclosure, property sale and, if applicable,
mortgage insurance claims processes, it can take 18 months
or longer for a loan to migrate from initial delinquency to
final disposition. This resolution process generally takes
much longer for loans secured by real estate than for unse-
cured loans or loans secured by other property primarily due
to state real estate foreclosure laws.
The allocated allowance balances for TCF’s residential,
consumer and leasing and equipment finance portfolios,
at December 31, 2007, reflect the Company’s credit quality
and related low level of historical net charge-offs for these
portfolios. The increase in the consumer home equity
allowance from December 31, 2006, to December 31, 2007,
is primarily due to increased actual and estimated home
equity loan charge-offs due to the slowdown in the housing
markets that occurred primarily in Minnesota and Michigan.
The decrease in the allocated allowance for leasing and
equipment finance in 2005 was primarily related to the
charge-off of the investment in a leveraged lease.