TCF Bank 2007 Annual Report Download - page 63
Download and view the complete annual report
Please find page 63 of the 2007 TCF Bank annual report below. You can navigate through the pages in the report by either clicking on the pages listed below, or by using the keyword search tool below to find specific information within the annual report.-
 1
1 -
2
-
3
-
4
-
5
-
6
-
7
-
8
-
9
-
10
-
11
-
12
-
13
-
14
-
15
-
16
-
17
-
18
-
19
-
20
-
21
-
22
-
23
-
24
-
25
-
26
-
27
-
28
-
29
-
30
-
31
-
32
-
33
-
34
-
35
-
36
-
37
-
38
-
39
-
40
-
41
-
42
-
43
-
44
-
45
-
46
-
47
-
48
-
49
-
50
-
51
-
52
-
 53
53 -
 54
54 -
 55
55 -
 56
56 -
 57
57 -
 58
58 -
 59
59 -
 60
60 -
 61
61 -
 62
62 -
 63
63 -
 64
64 -
 65
65 -
 66
66 -
 67
67 -
 68
68 -
 69
69 -
 70
70 -
 71
71 -
 72
72 -
 73
73 -
74
-
75
-
76
-
77
-
78
-
79
-
80
-
81
-
82
-
83
-
84
-
85
-
86
-
87
-
88
-
89
-
90
-
91
-
92
-
93
-
94
-
95
-
96
-
97
-
98
-
99
-
100
-
101
-
102
-
103
-
104
-
105
-
106
-
107
-
108
-
109
-
110
-
111
-
112
-
113
-
114
 |
 |
2007 Form 10-K | 43
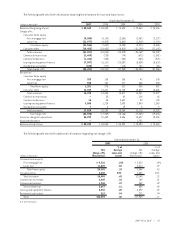
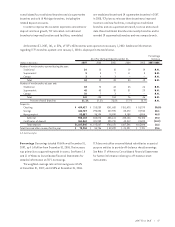
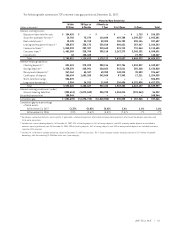
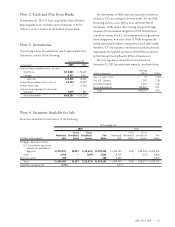
The following table summarizes TCF’s interest-rate gap position at December 31, 2007.
Maturity/Rate Sensitivity
Within 30 Days to 6 Months to
(Dollars in thousands) 30 Days 6 Months 1 Year 1 to 3 Years 3+ Years Total
Interest-earning assets:
Education loans held for sale $ 154,420 $ – $ – $ – $ 1,715 $ 156,135
Securities available for sale(1) 16,702 75,574 114,080 407,788 1,349,537 1,963,681
Real estate loans(1) 10,135 53,318 59,305 106,703 298,146 527,607
Leasing and equipment finance(1) 158,872 338,173 339,010 880,621 387,667 2,104,343
Commercial loans(1) 1,048,332 209,387 310,660 815,712 731,564 3,115,655
Consumer loans(1) 1,401,380 318,708 355,118 1,267,273 3,248,152 6,590,631
Investments 10 120,465 – – 27,792 148,267
Total 2,789,851 1,115,625 1,178,173 3,478,097 6,044,573 14,606,319
Interest-bearing liabilities:
Checking deposits(2) 821,415 278,203 288,116 887,756 1,833,037 4,108,527
Savings deposits(2) 1,238,278 228,901 220,862 563,511 385,268 2,636,820
Money market deposits(2) 267,164 65,347 60,358 148,215 35,583 576,667
Certificates of deposit 206,634 1,601,285 342,060 87,345 17,211 2,254,535
Short-term borrowings 556,070 – – – – 556,070
Long-term borrowings(3) 2,904 14,931 11,049 236,456 4,152,038 4,417,378
Total 3,092,465 2,188,667 922,445 1,923,283 6,423,137 14,549,997
Interest-earning assets over (under)
interest-bearing liabilities (302,614) (1,073,042) 255,728 1,554,814 (378,564) 56,322
Unsettled transactions 100,944––––100,944
Cumulative gap $ (201,670) $(1,274,712) $(1,018,984) $ 535,830 $ 157,266 $ 157,266
Cumulative gap as a percentage
of total assets:
At December 31, 2007 (1.3)% (8.0)% (6.4)% 3.4% 1.0% 1.0%
At December 31, 2006 2.9% (4.6)% (4.3)% (7.4)% .7% .7%
(1) Based upon contractual maturity, repricing date, if applicable, scheduled repayments of principal and projected prepayments of principal based upon experience and
third-party projections.
(2) Includes non-interest bearing deposits. At December 31, 2007, 34% of checking deposits, 64% of savings deposits, and 68% of money market deposits are included in
amounts repricing within one year. At December 31, 2006, 30% of checking deposits, 56% of savings deposits, and 64% of money market deposits are included in amounts
repricing within one year.
(3) Includes $4.167 billion of callable borrowings. Based on December 31, 2007 interest rates. The 1-3 year category includes the projected call of $217 million of callable
borrowings, with the remaining $3.95 billion in the over 3 year category.