TCF Bank 2007 Annual Report Download - page 50
Download and view the complete annual report
Please find page 50 of the 2007 TCF Bank annual report below. You can navigate through the pages in the report by either clicking on the pages listed below, or by using the keyword search tool below to find specific information within the annual report.-
 1
1 -
2
-
3
-
4
-
5
-
6
-
7
-
8
-
9
-
10
-
11
-
12
-
13
-
14
-
15
-
16
-
17
-
18
-
19
-
20
-
21
-
22
-
23
-
24
-
25
-
26
-
27
-
28
-
29
-
30
-
31
-
32
-
33
-
34
-
35
-
36
-
37
-
38
-
39
-
 40
40 -
 41
41 -
 42
42 -
 43
43 -
 44
44 -
 45
45 -
 46
46 -
 47
47 -
 48
48 -
 49
49 -
 50
50 -
 51
51 -
 52
52 -
 53
53 -
 54
54 -
 55
55 -
 56
56 -
 57
57 -
 58
58 -
 59
59 -
 60
60 -
61
-
62
-
63
-
64
-
65
-
66
-
67
-
68
-
69
-
70
-
71
-
72
-
73
-
74
-
75
-
76
-
77
-
78
-
79
-
80
-
81
-
82
-
83
-
84
-
85
-
86
-
87
-
88
-
89
-
90
-
91
-
92
-
93
-
94
-
95
-
96
-
97
-
98
-
99
-
100
-
101
-
102
-
103
-
104
-
105
-
106
-
107
-
108
-
109
-
110
-
111
-
112
-
113
-
114
 |
 |
30 | TCF Financial Corporation and Subsidiaries
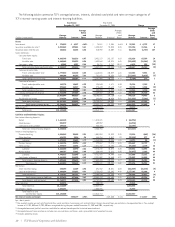
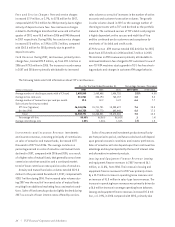
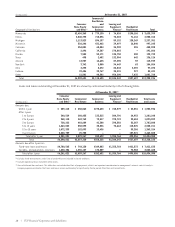
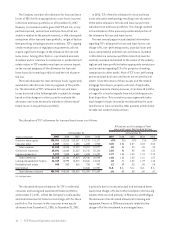
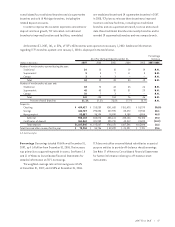
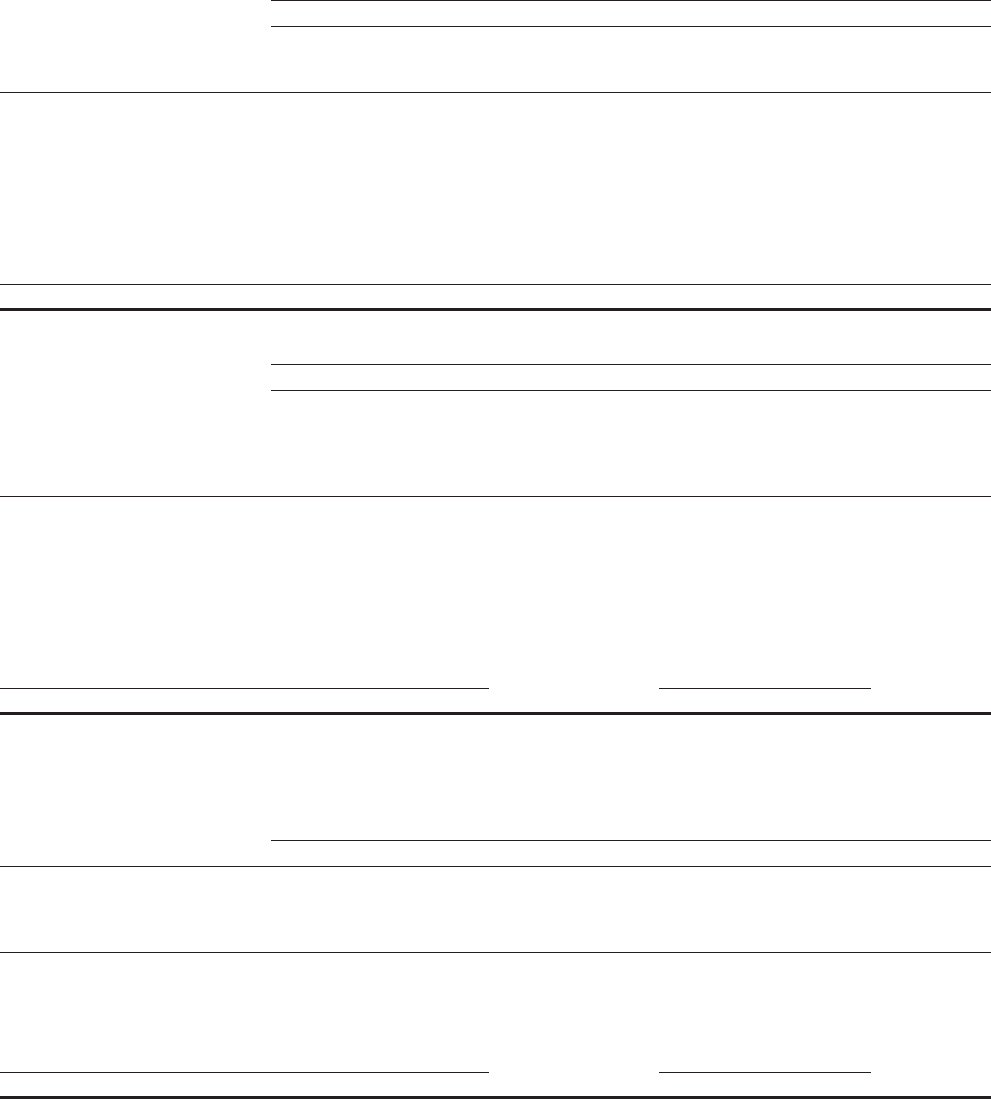
The following tables summarize TCF’s commercial real estate loan portfolio by property type.
At December 31,
2007 2006
Construction Construction
and and
(Dollars in thousands) Permanent Development Total Permanent Development Total
Retail services $ 634,331 $ 56,585 $ 690,916 $ 537,123 $ 37,568 $ 574,691
Apartments 464,283 8,773 473,056 454,269 957 455,226
Office buildings 350,807 27,110 377,917 395,076 10,662 405,738
Warehouse/industrial buildings 343,050 19,115 362,165 297,348 10,375 307,723
Hotels and motels 125,654 27,962 153,616 105,737 2,266 108,003
Residential home builders 41,750 58,952 100,702 40,697 69,249 109,946
Health care facilities 30,035 – 30,035 54,063 – 54,063
Other 290,290 78,633 368,923 317,683 57,580 375,263
Total $2,280,200 $277,130 $2,557,330 $2,201,996 $188,657 $2,390,653
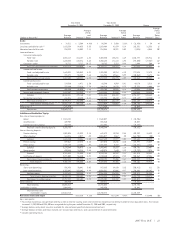
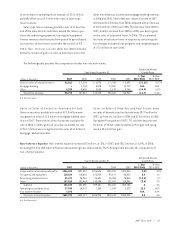
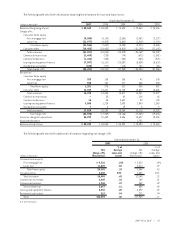
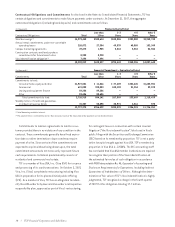
At December 31,
2007 2006
Over 30-Day Over 30-Day
Delinquency Delinquency
Rate as a Rate as a
Number Percentage of Number Percentage of
(Dollars in thousands) Balance of Loans Balance Balance of Loans Balance
Retail services $ 690,916 490 .67% $574,691 437 .03%
Apartments 473,056 551 .08 455,226 591 .02
Office buildings 377,917 248 .65 405,738 270 –
Warehouse/industrial buildings 362,165 283 .13 307,723 274 –
Hotels and motels 153,616 51 – 108,003 39 –
Residential home builders 100,702 87 1.81 109,946 97 .16
Health care facilities 30,035 11 – 54,063 16 –
Other 368,923 242 .50 375,263 253 4.69
Total $2,557,330 1,963 .45 $2,390,653 1,977 .76
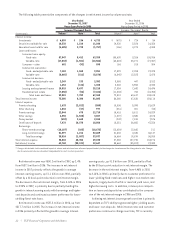
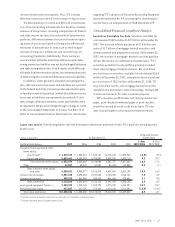
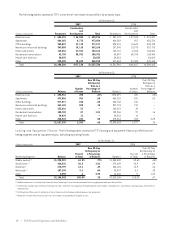
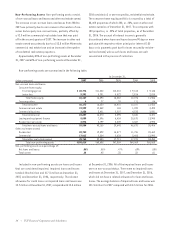
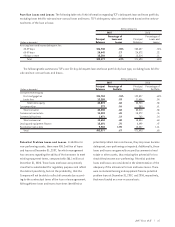
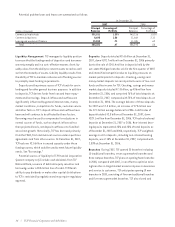
Leasing and Equipment Finance The following tables summarize TCF’s leasing and equipment finance portfolio by mar-
keting segment and by equipment type, excluding operating leases.
At December 31,
(Dollars in thousands) 2007 2006
Over 30-Day Over 30-Day
Delinquency as Delinquency as
Percent a Percentage Percent a Percentage
Marketing Segment Balance of Total of Balance Balance of Total of Balance
Middle market(1) $1,290,923 61.3% .77% $1,084,549 59.6% .48%
Small ticket(2) 426,436 20.3 1.01 370,649 20.4 .59
Winthrop(3) 275,799 13.1 .49 253,125 13.9 .28
Wholesale(4) 107,195 5.1 .04 93,807 5.2 .33
Other 3,990 .2 3.28 16,035 .9 1.03
Total $2,104,343 100.0% .75 $1,818,165 100.0% .47
(1) Middle market consists primarily of loan and lease financing of construction and manufacturing equipment and specialty vehicles.
(2) Small ticket includes loan and lease financings to small- and mid-size companies through programs with vendors, manufacturers, distributors, buying groups, and franchise
organizations.
(3) Winthrop’s portfolio consists primarily of lease financing of technology and data processing equipment.
(4) Wholesale includes the discounting of lease receivables originated by third party lessors.