TCF Bank 2007 Annual Report Download - page 57
Download and view the complete annual report
Please find page 57 of the 2007 TCF Bank annual report below. You can navigate through the pages in the report by either clicking on the pages listed below, or by using the keyword search tool below to find specific information within the annual report.-
 1
1 -
2
-
3
-
4
-
5
-
6
-
7
-
8
-
9
-
10
-
11
-
12
-
13
-
14
-
15
-
16
-
17
-
18
-
19
-
20
-
21
-
22
-
23
-
24
-
25
-
26
-
27
-
28
-
29
-
30
-
31
-
32
-
33
-
34
-
35
-
36
-
37
-
38
-
39
-
40
-
41
-
42
-
43
-
44
-
45
-
46
-
 47
47 -
 48
48 -
 49
49 -
 50
50 -
 51
51 -
 52
52 -
 53
53 -
 54
54 -
 55
55 -
 56
56 -
 57
57 -
 58
58 -
 59
59 -
 60
60 -
 61
61 -
 62
62 -
 63
63 -
 64
64 -
 65
65 -
 66
66 -
 67
67 -
68
-
69
-
70
-
71
-
72
-
73
-
74
-
75
-
76
-
77
-
78
-
79
-
80
-
81
-
82
-
83
-
84
-
85
-
86
-
87
-
88
-
89
-
90
-
91
-
92
-
93
-
94
-
95
-
96
-
97
-
98
-
99
-
100
-
101
-
102
-
103
-
104
-
105
-
106
-
107
-
108
-
109
-
110
-
111
-
112
-
113
-
114
 |
 |

2007 Form 10-K | 37
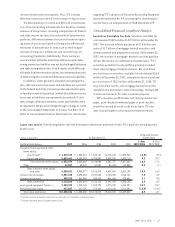
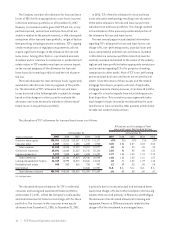
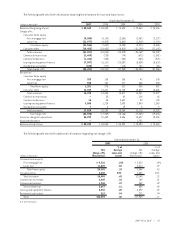
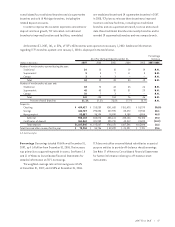
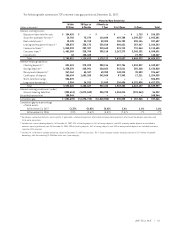
At December 31, 2007, 141, or 31%, of TCF’s 453 branches were opened since January 1, 2002. Additional information
regarding TCF’s branches opened since January 1, 2002 is displayed in the table below.
Percentage
At or For the Year Ended December 31, Increase
(Dollars in thousands) 2007 2006 2005 2004 2003 2007/2006
Number of new branches opened during the year:
Traditional 10 10 18 19 14 N.M.
Supermarket 55 7 11 5 N.M.
Campus 34 3 – – N.M.
Total 18 19 28 30 19 N.M.
Number of new branches at year end:
Traditional 83 73 63 45 26 N.M.
Supermarket 48 43 38 31 20 N.M.
Campus 10 7 3 – – N.M.
Total 141 123 104 76 46 N.M.
Percent of total branches 31.1% 27.2% 23.0% 17.7% 10.7% N.M.
Deposits:
Checking $ 409,427 $ 315,030 $241,688 $151,475 $ 53,370 30.0%
Savings 442,749 298,854 227,925 85,472 37,934 48.1
Money market 53,007 36,194 18,998 8,189 4,904 46.5
Subtotal 905,183 650,078 488,611 245,136 96,208 39.2
Certificates of deposit 361,862 421,989 293,720 42,212 19,690 (14.2)
Total deposits $1,267,045 $1,072,067 $782,331 $287,348 $115,898 18.2
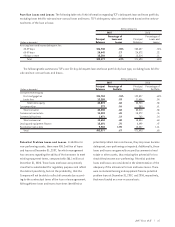
Total fees and other revenue for the year $ 73,204 $ 54,786 $ 39,699 $ 24,091 $ 7,221 33.6
N.M. Not Meaningful.
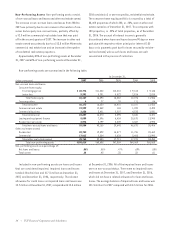
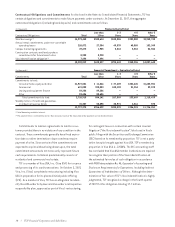
Borrowings Borrowings totaled $5 billion at December 31,
2007, up $1.4 billion from December 31, 2006. The increase
was primarily to support the growth in assets. See Notes 10
and 11 of Notes to Consolidated Financial Statements for
detailed information on TCF’s borrowings.
The weighted-average rate on borrowings was 4.51%
at December 31, 2007, and 4.53% at December 31, 2006.
TCF does not utilize unconsolidated subsidiaries or special
purpose entities to provide off-balance sheet borrowings.
See Note 17 of Notes to Consolidated Financial Statements
for further information relating to off-balance sheet
instruments.
consolidated four traditional branches and six supermarket
branches and sold 10 Michigan branches, including the
related deposit accounts.
In order to improve the customer experience and enhance
deposit and loan growth, TCF relocated six traditional
branches to improved locations and facilities, remodeled
one traditional branch and 14 supermarket branches in 2007.
In 2008, TCF plans to relocate three branches to improved
locations and new facilities, including two traditional
branches and one supermarket branch, to close and consoli-
date three traditional branches into nearby branches and to
remodel 19 supermarket branches and one campus branch.