TCF Bank 2007 Annual Report Download - page 39
Download and view the complete annual report
Please find page 39 of the 2007 TCF Bank annual report below. You can navigate through the pages in the report by either clicking on the pages listed below, or by using the keyword search tool below to find specific information within the annual report.-
 1
1 -
2
-
3
-
4
-
5
-
6
-
7
-
8
-
9
-
10
-
11
-
12
-
13
-
14
-
15
-
16
-
17
-
18
-
19
-
20
-
21
-
22
-
23
-
24
-
25
-
26
-
27
-
28
-
 29
29 -
 30
30 -
 31
31 -
 32
32 -
 33
33 -
 34
34 -
 35
35 -
 36
36 -
 37
37 -
 38
38 -
 39
39 -
 40
40 -
 41
41 -
 42
42 -
 43
43 -
 44
44 -
 45
45 -
 46
46 -
 47
47 -
 48
48 -
 49
49 -
50
-
51
-
52
-
53
-
54
-
55
-
56
-
57
-
58
-
59
-
60
-
61
-
62
-
63
-
64
-
65
-
66
-
67
-
68
-
69
-
70
-
71
-
72
-
73
-
74
-
75
-
76
-
77
-
78
-
79
-
80
-
81
-
82
-
83
-
84
-
85
-
86
-
87
-
88
-
89
-
90
-
91
-
92
-
93
-
94
-
95
-
96
-
97
-
98
-
99
-
100
-
101
-
102
-
103
-
104
-
105
-
106
-
107
-
108
-
109
-
110
-
111
-
112
-
113
-
114
 |
 |
2007 Form 10-K | 19
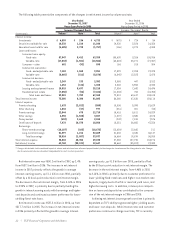
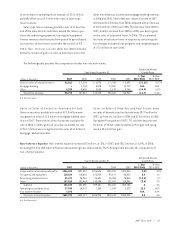
The provision for credit losses totaled $51.7 million in
2007, up from $18.1 million in 2006. The increase in the pro-
vision for credit losses from 2006 is primarily due to higher
consumer home equity net charge-offs and the resulting
portfolio reserve rate increases and increased reserves for
certain commercial loans. Refer to the “Consolidated
Income Statement Analysis – Provision for Credit Losses”
section for further discussion.
Non-interest income totaled $481.3 million in 2007, up
from $428.4 million in 2006. Fees and service charges were
$278 million for 2007, up 2.9% from $270.2 million in 2006.
In 2006 there were $5.3 million in fees and service charges
related to the Michigan sold branches. Card revenues were
$98.9 million for 2007, up 7.4% from $92.1 million in 2006.
This increase was primarily attributable to an increased
sales volume as a result of increases in transactions per
account and the number of active accounts. During 2007,
TCF sold 10 out-state branches and recognized gains of
$31.2 million and sold five branch buildings and five parcels
of land and recognized gains of $6.7 million. During 2006,
TCF sold two branch buildings and one land parcel and recog-
nized gains of $4.2 million. Also, during 2007 TCF recognized
$13.3 million of gains on sales of $1.2 billion of mortgage-
backed securities. There were no sales of securities in 2006.
See “Consolidated Income Statement Analysis – Non-Interest
Income” for further discussion.
Non-interest expense totaled $594.7 million in 2007, up
1.6% from $585.5 million in 2006. The increase was primarily
due to a $7.7 million charge for TCF’s estimated contingent
liability related to Visa USA litigation indemnification.
See page 38 under Management’s Discussion and Analysis
for details of TCF’s obligations to indemnify Visa for
certain litigation.
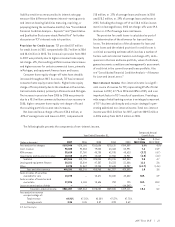
LEASING AND EQUIPMENT FINANCE, an operating segment
composed of TCF’s wholly-owned subsidiaries TCF Equipment
Finance and Winthrop Resources, provides a broad range
of comprehensive lease and equipment finance products.
Leasing and equipment finance reported net income of
$34.6 million for 2007, up 3.6% from $33.4 million in 2006.
Net interest income for 2007 was $65.4 million, up 11.4%
from $58.7 million in 2006.
The provision for credit losses for this operating segment
totaled $5.3 million in 2007, up from $2.6 million in 2006.
The increase in the provision for credit losses from 2006 to
2007 was primarily due to increases in reserves for certain
loans and leases, partially offset by a recovery in 2007 of a
previously charged-off lease. In addition, 2006 included a
reduction of reserves in certain marketing segments due to
lower levels of historical charge-offs and one large non-
accrual lease that was settled in the second quarter of 2006
for less than the amount reserved.
Non-interest income totaled $59.2 million in 2007, up
$6.1 million from $53 million in 2006. The increase in leasing
and equipment finance revenues for 2007, compared with
2006, was primarily due to higher operating lease and sales-
type lease revenues.
Non-interest expense totaled $65.4 million in 2007, up
$8.4 million from $56.9 million in 2006 primarily related to an
increase of $4 million in compensation and benefits which
included an increase in commissions resulting from a larger
volume of sales-type leases and other commissioned events,
increased salaries related to headcount expansion and an
increase of $3.2 million in operating lease depreciation.
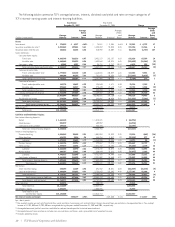
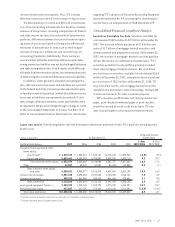
Consolidated Income Statement Analysis
Net Interest Income Net interest income, the difference
between interest earned on loans and leases, securities
available for sale, investments and other interest-earning
assets (interest income), and interest paid on deposits and
borrowings (interest expense), represented 50.4% of TCF’s
total revenue in 2007, 52.3% in 2006 and 52% in 2005. Net
interest income divided by average interest-earning assets
is referred to as the net interest margin, expressed as a
percentage. Net interest income and net interest margin
are affected by changes in interest rates, loan and deposit
pricing strategies and competitive conditions, the volume
and the mix of interest-earning assets and interest-bearing
liabilities, and the level of non-performing assets.