TCF Bank 2007 Annual Report Download - page 47
Download and view the complete annual report
Please find page 47 of the 2007 TCF Bank annual report below. You can navigate through the pages in the report by either clicking on the pages listed below, or by using the keyword search tool below to find specific information within the annual report.-
 1
1 -
2
-
3
-
4
-
5
-
6
-
7
-
8
-
9
-
10
-
11
-
12
-
13
-
14
-
15
-
16
-
17
-
18
-
19
-
20
-
21
-
22
-
23
-
24
-
25
-
26
-
27
-
28
-
29
-
30
-
31
-
32
-
33
-
34
-
35
-
36
-
 37
37 -
 38
38 -
 39
39 -
 40
40 -
 41
41 -
 42
42 -
 43
43 -
 44
44 -
 45
45 -
 46
46 -
 47
47 -
 48
48 -
 49
49 -
 50
50 -
 51
51 -
 52
52 -
 53
53 -
 54
54 -
 55
55 -
 56
56 -
 57
57 -
58
-
59
-
60
-
61
-
62
-
63
-
64
-
65
-
66
-
67
-
68
-
69
-
70
-
71
-
72
-
73
-
74
-
75
-
76
-
77
-
78
-
79
-
80
-
81
-
82
-
83
-
84
-
85
-
86
-
87
-
88
-
89
-
90
-
91
-
92
-
93
-
94
-
95
-
96
-
97
-
98
-
99
-
100
-
101
-
102
-
103
-
104
-
105
-
106
-
107
-
108
-
109
-
110
-
111
-
112
-
113
-
114
 |
 |

2007 Form 10-K | 27
increase state income tax expense. Thus, TCF’s annual
effective income tax rate will likely increase in future years.
The determination of current and deferred income taxes
is a critical accounting estimate which is based on complex
analyses of many factors including interpretation of federal
and state income tax laws, the evaluation of uncertain tax
positions, differences between the tax and financial report-
ing bases of assets and liabilities (temporary differences),
estimates of amounts due or owed such as the timing of
reversal of temporary differences and current financial
accounting standards. Additionally, there can be no
assurance that estimates and interpretations used in deter-
mining income tax liabilities may not be challenged by federal
and state taxing authorities. Actual results could differ sig-
nificantly from the estimates and tax law interpretations used
in determining the current and deferred income tax liabilities.
In addition, under generally accepted accounting princi-
ples, deferred income tax assets and liabilities are recorded
at the federal and state income tax rates expected to apply
to taxable income in the periods in which the deferred income
tax assets or liabilities are expected to be realized. If such
rates change, deferred income tax assets and liabilities must
be adjusted in the period of change through a charge or credit
to the Consolidated Statements of Income. See Note 12 of
Notes to Consolidated Financial Statements for information
regarding TCF’s adoption of Financial Accounting Standards
Board Interpretation No. 48, Accounting for Uncertainty in
Income Taxes, an interpretation of FASB Statement 109.
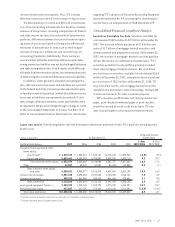
Consolidated Financial Condition Analysis
Securities Available for Sale Securities available for
sale increased $147.6 million to $2.0 billion at December 31,
2007. This increase reflects purchases of $1.6 billion and
sales of $1.2 billion of mortgage-backed securities, and
normal payment and prepayment activity. At December 31,
2007, the increase in mortgage-backed securities partially
offsets the decline in residential real estate loans. TCF’s
securities available for sale portfolio primarily included
fixed-rate mortgage-backed securities. Net unrealized
pre-tax losses on securities available for sale totaled $16.4
million at December 31, 2007, compared with net unrealized
pre-tax losses of $33.3 million at December 31, 2006. TCF
may, from time to time, sell mortgage-backed securities
and utilize the proceeds to reduce borrowings, fund growth
in loans and leases or for other corporate purposes.
TCF’s securities portfolio does not contain commercial
paper, asset-backed commercial paper or asset-backed
securities secured by credit cards or car loans. TCF also
does not participate in structured investment vehicles.
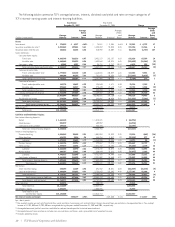
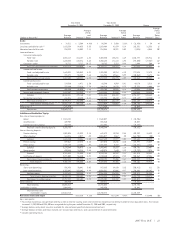
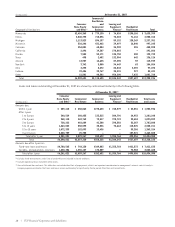
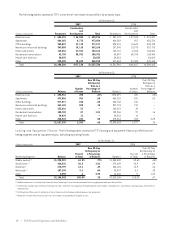
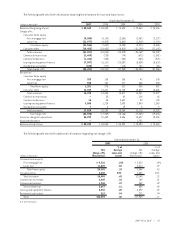
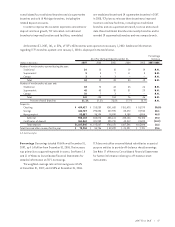
Loans and Leases The following tables set forth information about loans and leases held in TCF’s portfolio, excluding loans
held for sale.
Compound Annual
(Dollars in thousands) At December 31, Growth Rate
1-Year 5-Year
Portfolio Distribution: 2007 2006 2005 2004 2003 2007/2006 2007/2002
Consumer home equity and other:
Home equity:
Line of credit(1) $ 1,429,633 $ 1,232,315 $ 1,389,741 $1,472,165 $1,093,945 16.0% 9.1%
Closed-end loans 5,093,441 4,650,353 3,758,947 2,909,592 2,493,715 9.5 20.2
Total consumer home equity 6,523,074 5,882,668 5,148,688 4,381,757 3,587,660 10.9 17.2
Other 67,557 62,409 57,587 56,183 62,538 8.2 (.1)
Total consumer home equity
and other 6,590,631 5,945,077 5,206,275 4,437,940 3,650,198 10.9 16.9
Commercial real estate 2,557,330 2,390,653 2,297,500 2,154,396 1,916,701 7.0 6.9
Commercial business 558,325 551,995 435,203 436,696 429,401 1.1 4.8
Total commercial 3,115,655 2,942,648 2,732,703 2,591,092 2,346,102 5.9 6.5
Leasing and equipment finance (2) 2,104,343 1,818,165 1,503,794 1,375,372 1,160,397 15.7 15.2
Residential real estate 527,607 627,790 770,441 1,014,166 1,212,643 (16.0) (21.8)
Total loans and leases $12,338,236 $11,333,680 $10,213,213 $9,418,570 $8,369,340 8.9 8.7
(1) Excludes fixed-term amounts under lines of credit which are included in closed-end loans.
(2) Excludes operating leases included in other assets.