TCF Bank 2007 Annual Report Download - page 53
Download and view the complete annual report
Please find page 53 of the 2007 TCF Bank annual report below. You can navigate through the pages in the report by either clicking on the pages listed below, or by using the keyword search tool below to find specific information within the annual report.-
 1
1 -
2
-
3
-
4
-
5
-
6
-
7
-
8
-
9
-
10
-
11
-
12
-
13
-
14
-
15
-
16
-
17
-
18
-
19
-
20
-
21
-
22
-
23
-
24
-
25
-
26
-
27
-
28
-
29
-
30
-
31
-
32
-
33
-
34
-
35
-
36
-
37
-
38
-
39
-
40
-
41
-
42
-
 43
43 -
 44
44 -
 45
45 -
 46
46 -
 47
47 -
 48
48 -
 49
49 -
 50
50 -
 51
51 -
 52
52 -
 53
53 -
 54
54 -
 55
55 -
 56
56 -
 57
57 -
 58
58 -
 59
59 -
 60
60 -
 61
61 -
 62
62 -
 63
63 -
64
-
65
-
66
-
67
-
68
-
69
-
70
-
71
-
72
-
73
-
74
-
75
-
76
-
77
-
78
-
79
-
80
-
81
-
82
-
83
-
84
-
85
-
86
-
87
-
88
-
89
-
90
-
91
-
92
-
93
-
94
-
95
-
96
-
97
-
98
-
99
-
100
-
101
-
102
-
103
-
104
-
105
-
106
-
107
-
108
-
109
-
110
-
111
-
112
-
113
-
114
 |
 |

2007 Form 10-K | 33
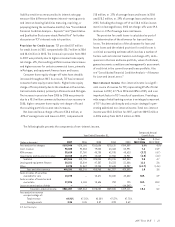
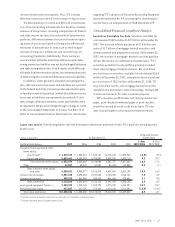
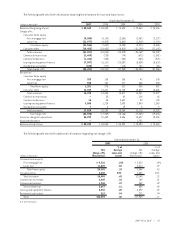
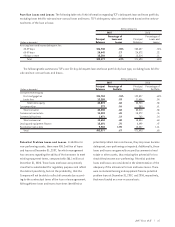
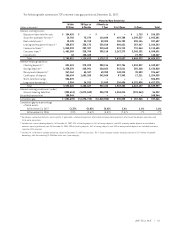
The following table sets forth information detailing the allowance for loan and lease losses.
Year Ended December 31,
(Dollars in thousands) 2007 2006 2005 2004 2003
Balance at beginning of year $ 58,543 $ 55,823 $ 75,393 $ 72,460 $ 73,016
Charge-offs:
Consumer home equity
First mortgage lien (9,589) (3,142) (2,363) (2,051) (2,127)
Junior lien (11,977) (4,479) (2,841) (1,919) (1,719)
Total home equity (21,566) (7,621) (5,204) (3,970) (3,846)
Consumer other (19,455) (18,423) (18,675) (21,199) (17,103)
Total consumer (41,021) (26,044) (23,879) (25,169) (20,949)
Commercial real estate (2,409) (228) (74) (602) (1,381)
Commercial business (1,264) (555) (454) (235) (920)
Leasing and equipment finance (7,507) (6,117) (23,387) (8,508) (8,620)
Residential real estate (220) (277) (110) (81) (86)
Total charge-offs (52,421) (33,221) (47,904) (34,595) (31,956)
Recoveries:
Consumer home equity
First mortgage lien 253 108 135 42 138
Junior lien 948 167 177 266 253
Total home equity 1,201 275 312 308 391
Consumer other 13,019 13,621 14,705 13,623 10,686
Total consumer 14,220 13,896 15,017 13,931 11,077
Commercial real estate –39 82 126 45
Commercial business 16 86 2,627 82 138
Leasing and equipment finance 3,585 1,225 2,003 2,963 1,083
Residential real estate 76 19 8 9
Total recoveries 17,828 15,252 19,748 17,110 12,352
Net charge-offs (34,593) (17,969) (28,156) (17,485) (19,604)
Provision charged to operations 56,992 20,689 8,586 18,627 19,048
Acquired allowance –– – 1,791 –
Balance at end of year $ 80,942 $ 58,543 $ 55,823 $ 75,393 $ 72,460
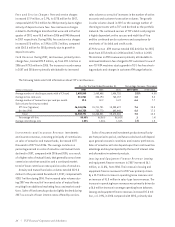
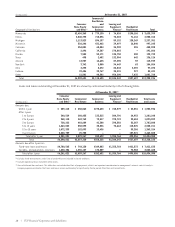
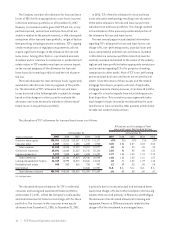
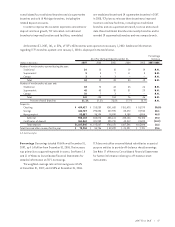
The following table sets forth additional information regarding net charge-offs.
Year Ended December 31,
2007 2006
% of % of
Net Average Net Average
Charge-offs Loans and Charge-offs Loans and
(Dollars in thousands) (Recoveries) Leases (Recoveries) Leases
Consumer home equity
First mortgage lien $ 9,336 .24% $ 3,032 .09%
Junior lien 11,029 .50 4,314 .22
Total home equity 20,365 .33 7,346 .13
Consumer other 6,436 N.M. 4,802 N.M.
Total consumer 26,801 .43 12,148 .22
Commercial real estate 2,409 .10 189 .01
Commercial business 1,248 .22 469 .09
Total commercial 3,657 .12 658 .02
Leasing and equipment finance 3,922 .20 4,892 .29
Residential real estate 213 .04 271 .04
Total $34,593 .30 $17,969 .17
N.M. Not Meaningful.