Seagate 2013 Annual Report Download - page 86
Download and view the complete annual report
Please find page 86 of the 2013 Seagate annual report below. You can navigate through the pages in the report by either clicking on the pages listed below, or by using the keyword search tool below to find specific information within the annual report.-
 1
1 -
2
-
3
-
4
-
5
-
6
-
7
-
8
-
9
-
10
-
11
-
12
-
13
-
14
-
15
-
16
-
17
-
18
-
19
-
20
-
21
-
22
-
23
-
24
-
25
-
26
-
27
-
28
-
29
-
30
-
31
-
32
-
33
-
34
-
35
-
36
-
37
-
38
-
39
-
40
-
41
-
42
-
43
-
44
-
45
-
46
-
47
-
48
-
49
-
50
-
51
-
52
-
53
-
54
-
55
-
56
-
57
-
58
-
59
-
60
-
61
-
62
-
63
-
64
-
65
-
66
-
67
-
68
-
69
-
70
-
71
-
72
-
73
-
74
-
75
-
 76
76 -
 77
77 -
 78
78 -
 79
79 -
 80
80 -
 81
81 -
 82
82 -
 83
83 -
 84
84 -
 85
85 -
 86
86 -
 87
87 -
 88
88 -
 89
89 -
 90
90 -
 91
91 -
 92
92 -
 93
93 -
 94
94 -
 95
95 -
 96
96 -
97
-
98
-
99
-
100
-
101
-
102
-
103
-
104
-
105
-
106
-
107
-
108
-
109
-
110
-
111
-
112
-
113
-
114
-
115
-
116
-
117
-
118
-
119
-
120
-
121
-
122
-
123
-
124
-
125
-
126
-
127
-
128
-
129
-
130
-
131
-
132
-
133
-
134
-
135
-
136
-
137
-
138
-
139
-
140
-
141
-
142
-
143
-
144
-
145
-
146
-
147
-
148
-
149
-
150
-
151
-
152
-
153
-
154
-
155
-
156
-
157
-
158
-
159
-
160
-
161
-
162
-
163
-
164
-
165
-
166
-
167
-
168
-
169
-
170
-
171
-
172
-
173
-
174
-
175
-
176
-
177
-
178
-
179
-
180
-
181
-
182
-
183
-
184
-
185
-
186
-
187
-
188
-
189
-
190
-
191
-
192
-
193
-
194
-
195
-
196
-
197
-
198
-
199
-
200
-
201
-
202
-
203
-
204
-
205
 |
 |

Table of Contents
SEAGATE TECHNOLOGY PLC
NOTES TO CONSOLIDATED FINANCIAL STATEMENTS—(Continued)
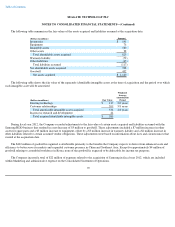
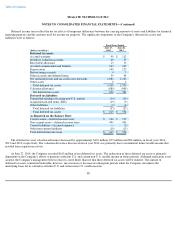
The amounts of revenue and earnings of the acquired assets of Samsung's HDD business included in the Company's Consolidated Statement
of Operations from the acquisition date to the period ended June 29, 2012, were as follows:
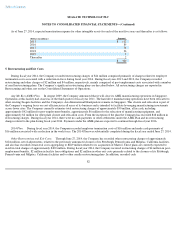
The unaudited pro forma financial results presented below for the fiscal year ended June 29, 2012, include the effects of pro forma
adjustments as if the acquisition date occurred as of the beginning of the prior fiscal year on July 3, 2010. The pro forma results combine the
historical results of the Company for the fiscal year ended June 29, 2012 and the historical results of the acquired assets and liabilities of
Samsung's HDD business, and include the effects of certain fair value adjustments and the elimination of certain activities excluded from the
transaction. The pro forma financial information is presented for informational purposes only and is not necessarily indicative of the results of
operations that would have been achieved if the acquisition had taken place at the beginning of the earliest period presented, nor is it intended to
be a projection of future results.
The pro forma results for the fiscal year ended June 29, 2012, includes an adjustment of $65 million to reflect the additional depreciation
and amortization that would have been charged assuming the fair value adjustments to property, plant and equipment and intangible assets had
been applied on July 3, 2010.
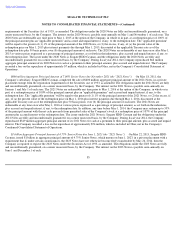
4. Goodwill and Other Intangible Assets
Goodwill
The changes in the carrying amount of goodwill are as follows:
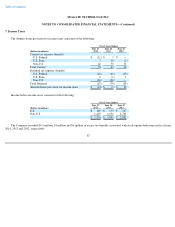
Other Intangible Assets
Other intangible assets consist primarily of existing technology, customer relationships and in-process research and development acquired
in business combinations. With the exception of in-process research and development, acquired intangibles are amortized on a straight-line basis
over the respective estimated useful lives of the assets. Amortization of the existing technology intangible asset is charged to Cost of revenue
while the amortization of the other intangible assets is included in Operating expenses in the Consolidated Statements of Operations. In-process
research and development has been determined to
80
(Dollars in millions)
Amount
Revenue
$
970
Net income
$
104
(Dollars in millions)
Fiscal Year Ended
June 29, 2012
Revenue
$
16,113
Net income
$
2,761
(Dollars in millions)
Amount
Balance as of June 29, 2012
$
463
Goodwill acquired
13
1
1
1
1
Balance as of June 28, 2013
476
Goodwill acquired
60
Foreign currency translation effect
1
1
1
1
1
Balance as of June 27, 2014
$
537
1
1
1
1
1
1
1
1