Seagate 2013 Annual Report Download - page 58
Download and view the complete annual report
Please find page 58 of the 2013 Seagate annual report below. You can navigate through the pages in the report by either clicking on the pages listed below, or by using the keyword search tool below to find specific information within the annual report.-
 1
1 -
2
-
3
-
4
-
5
-
6
-
7
-
8
-
9
-
10
-
11
-
12
-
13
-
14
-
15
-
16
-
17
-
18
-
19
-
20
-
21
-
22
-
23
-
24
-
25
-
26
-
27
-
28
-
29
-
30
-
31
-
32
-
33
-
34
-
35
-
36
-
37
-
38
-
39
-
40
-
41
-
42
-
43
-
44
-
45
-
46
-
47
-
 48
48 -
 49
49 -
 50
50 -
 51
51 -
 52
52 -
 53
53 -
 54
54 -
 55
55 -
 56
56 -
 57
57 -
 58
58 -
 59
59 -
 60
60 -
 61
61 -
 62
62 -
 63
63 -
 64
64 -
 65
65 -
 66
66 -
 67
67 -
 68
68 -
69
-
70
-
71
-
72
-
73
-
74
-
75
-
76
-
77
-
78
-
79
-
80
-
81
-
82
-
83
-
84
-
85
-
86
-
87
-
88
-
89
-
90
-
91
-
92
-
93
-
94
-
95
-
96
-
97
-
98
-
99
-
100
-
101
-
102
-
103
-
104
-
105
-
106
-
107
-
108
-
109
-
110
-
111
-
112
-
113
-
114
-
115
-
116
-
117
-
118
-
119
-
120
-
121
-
122
-
123
-
124
-
125
-
126
-
127
-
128
-
129
-
130
-
131
-
132
-
133
-
134
-
135
-
136
-
137
-
138
-
139
-
140
-
141
-
142
-
143
-
144
-
145
-
146
-
147
-
148
-
149
-
150
-
151
-
152
-
153
-
154
-
155
-
156
-
157
-
158
-
159
-
160
-
161
-
162
-
163
-
164
-
165
-
166
-
167
-
168
-
169
-
170
-
171
-
172
-
173
-
174
-
175
-
176
-
177
-
178
-
179
-
180
-
181
-
182
-
183
-
184
-
185
-
186
-
187
-
188
-
189
-
190
-
191
-
192
-
193
-
194
-
195
-
196
-
197
-
198
-
199
-
200
-
201
-
202
-
203
-
204
-
205
 |
 |

Table of Contents
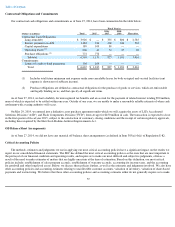
• a decrease of $538 million in accounts payable, primarily due to a reduction in direct materials purchases due to a decrease in
build volume in the fourth quarter of fiscal year 2013 compared to the prior year period;
• a decrease of $272 million in vendor non-trade receivables primarily due to a decrease in build volumes in the fourth quarter of
fiscal year 2013 compared to the prior year period;
• a decrease of $170 million in accrued expenses, income taxes and warranty, primarily due to decreases in costs related to sales
activities resulting from lower sales volumes; and
• a decrease of $102 million in inventory, due to lower volumes in the fourth quarter of fiscal year 2013 compared to the prior year
period.
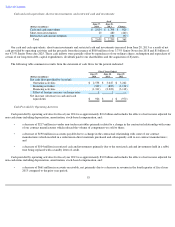
Cash provided by operating activities for fiscal year 2012 was approximately $3.3 billion and includes the effects of net income adjusted for
non-cash items including depreciation, amortization, stock-based compensation, impairment of long-lived assets, and:
• an increase of $824 million in accounts receivable, net, due to an increase in revenues;
• an increase of $157 million in accounts payable due to higher direct material purchases related to an increase in volume, partially
offset by a change in supplier payment terms; and
• an increase of $145 million in accrued employee compensation reflecting an increase in variable performance-based
compensation.
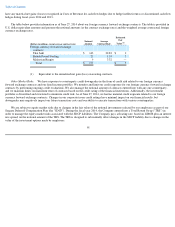
Cash Used in Investing Activities
In fiscal year 2014, we used $0.3 billion for net cash investing activities, which was primarily due to payments for property, equipment and
leasehold improvements of approximately $559 million and the acquisition of Xyratex, of $285 million, partially offset by $508 million of
proceeds from sales of short-term investments.
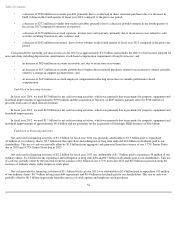
In fiscal year 2013, we used $0.8 billion for net cash investing activities, which was primarily due to payments for property, equipment and
leasehold improvements.
In fiscal year 2012, we used $1.1 billion for net cash investing activities, which was primarily due to payments for property, equipment and
leasehold improvements of approximately $0.6 billion and net payments for the acquisition of Samsung's HDD business of $0.6 billion.
Cash Used in Financing Activities
Net cash used in financing activities of $1.3 billion for fiscal year 2014 was primarily attributable to $1.9 billion paid to repurchase
41 million of our ordinary shares, $0.7 billion for the repurchase and redemption of long term debt and $0.6 billion in dividends paid to our
shareholders. This use of cash was partially offset by $1.8 billion from aggregate cash generated from the issuance of our 3.75% Senior Notes
due in 2018 and 4.75% Senior Notes due in 2025.
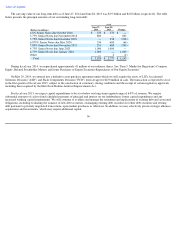
Net cash used in financing activities of $2.2 billion for fiscal year 2013 was attributable to $1.7 billion paid to repurchase 54 million of our
ordinary shares, $1.2 billion for the repurchase and redemption of long term debt and $0.5 billion in dividends paid to our shareholders. This use
of cash was partially offset by the proceeds from the issuance of $1 billion of our 4.75% notes due 2023 and $0.3 billion in proceeds from the
issuance of ordinary shares under employee stock plans.
Net cash provided by financing activities of $3.1 billion for fiscal year 2012 was attributable to $2.4 billion paid to repurchase 101 million
of our ordinary shares, $0.7 billion in long term debt repayments and $0.4 billion in dividends paid to our shareholders. This use of cash was
partially offset by $0.3 billion in proceeds from the exercise of stock options and employee stock purchases.
54