Seagate 2013 Annual Report Download - page 49
Download and view the complete annual report
Please find page 49 of the 2013 Seagate annual report below. You can navigate through the pages in the report by either clicking on the pages listed below, or by using the keyword search tool below to find specific information within the annual report.-
 1
1 -
2
-
3
-
4
-
5
-
6
-
7
-
8
-
9
-
10
-
11
-
12
-
13
-
14
-
15
-
16
-
17
-
18
-
19
-
20
-
21
-
22
-
23
-
24
-
25
-
26
-
27
-
28
-
29
-
30
-
31
-
32
-
33
-
34
-
35
-
36
-
37
-
38
-
 39
39 -
 40
40 -
 41
41 -
 42
42 -
 43
43 -
 44
44 -
 45
45 -
 46
46 -
 47
47 -
 48
48 -
 49
49 -
 50
50 -
 51
51 -
 52
52 -
 53
53 -
 54
54 -
 55
55 -
 56
56 -
 57
57 -
 58
58 -
 59
59 -
60
-
61
-
62
-
63
-
64
-
65
-
66
-
67
-
68
-
69
-
70
-
71
-
72
-
73
-
74
-
75
-
76
-
77
-
78
-
79
-
80
-
81
-
82
-
83
-
84
-
85
-
86
-
87
-
88
-
89
-
90
-
91
-
92
-
93
-
94
-
95
-
96
-
97
-
98
-
99
-
100
-
101
-
102
-
103
-
104
-
105
-
106
-
107
-
108
-
109
-
110
-
111
-
112
-
113
-
114
-
115
-
116
-
117
-
118
-
119
-
120
-
121
-
122
-
123
-
124
-
125
-
126
-
127
-
128
-
129
-
130
-
131
-
132
-
133
-
134
-
135
-
136
-
137
-
138
-
139
-
140
-
141
-
142
-
143
-
144
-
145
-
146
-
147
-
148
-
149
-
150
-
151
-
152
-
153
-
154
-
155
-
156
-
157
-
158
-
159
-
160
-
161
-
162
-
163
-
164
-
165
-
166
-
167
-
168
-
169
-
170
-
171
-
172
-
173
-
174
-
175
-
176
-
177
-
178
-
179
-
180
-
181
-
182
-
183
-
184
-
185
-
186
-
187
-
188
-
189
-
190
-
191
-
192
-
193
-
194
-
195
-
196
-
197
-
198
-
199
-
200
-
201
-
202
-
203
-
204
-
205
 |
 |

Table of Contents
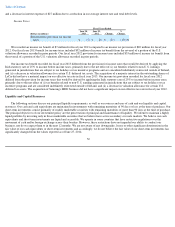
The industry's ability to manufacture and ship drives had substantially recovered as of the end of fiscal year 2012. In fiscal years 2013 and
2014, we believe the HDD industry's capacity to manufacture HDDs exceeded demand. However, following the impact of the flooding in
Thailand and further industry consolidation in fiscal year 2012, the HDD industry has maintained improved pricing discipline resulting in benign
price erosion in fiscal years 2013 and 2014.
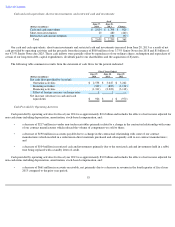
Demand Trends for Disk Drives
We believe that continued growth in digital content requires increasingly higher storage capacity in order to store, aggregate, host,
distribute, manage, backup and use such content. We also believe that as architectures evolve to serve the growing commercial and consumer
user base throughout the world, the manner which hard drives are delivered to market and utilized by our customers will evolve as well.
We believe that in the foreseeable future the traditional enterprise and client compute markets that require high capacity storage solutions,
as well as the data intensive client non-compute markets, will continue to be best served by hard disk drives due to the industry's ability to
deliver cost effective, reliable and energy efficient mass storage devices. Furthermore, the increased use of client non-compute devices that
consume media-rich digital content streamed from the cloud increases the demand for high capacity disk drives in nearline applications.
Price Erosion. Historically, our industry has been characterized by price declines for disk drive products with comparable capacity,
performance and feature sets ("like-for-like products").
Disk drive manufacturers typically attempt to offset price erosion with an improved mix of disk drive products characterized by higher
capacity, better performance and additional feature sets and/or product cost reductions.
Seasonality
The disk drive industry traditionally experiences seasonal variability in demand with higher levels of demand in the second half of the
calendar year. This seasonality is driven by consumer spending in the back-to-school season from late summer to fall and the traditional holiday
shopping season from fall to winter. In addition, corporate demand is typically higher during the second half of the calendar year.
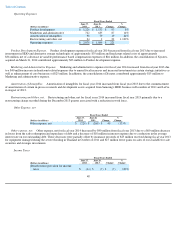
Fiscal Year 2014 Summary
During the fiscal year 2014, we shipped 220 million units totaling 202 exabytes, generating revenue of $13.7 billion and gross margins of
28% of revenue. Our operating cash flow was $2.6 billion. We issued $1 billion of 4.75% Senior Notes due 2025 and $800 million of 3.75%
Senior Notes due 2018 during the June 2014 and December 2013 quarters, respectively. We repurchased approximately 41 million of our
ordinary shares during the year for approximately $1.9 billion, paid dividends of $0.6 billion, paid $0.7 billion for the early redemption and
repurchase of debt with a principal value of $0.7 billion. Additionally, we acquired all of the outstanding shares of Xyratex Ltd ("Xyratex"), a
leading provider of data storage technology, for approximately $0.4 billion. During the June 2014 quarter, we entered into an agreement to
acquire LSI's Accelerated Solutions Division and Flash Components Division from Avago for approximately $0.5 billion. The LSI acquisition is
expected to close in the first quarter of the fiscal year 2015.
45