Seagate 2013 Annual Report Download - page 51
Download and view the complete annual report
Please find page 51 of the 2013 Seagate annual report below. You can navigate through the pages in the report by either clicking on the pages listed below, or by using the keyword search tool below to find specific information within the annual report.-
 1
1 -
2
-
3
-
4
-
5
-
6
-
7
-
8
-
9
-
10
-
11
-
12
-
13
-
14
-
15
-
16
-
17
-
18
-
19
-
20
-
21
-
22
-
23
-
24
-
25
-
26
-
27
-
28
-
29
-
30
-
31
-
32
-
33
-
34
-
35
-
36
-
37
-
38
-
39
-
40
-
 41
41 -
 42
42 -
 43
43 -
 44
44 -
 45
45 -
 46
46 -
 47
47 -
 48
48 -
 49
49 -
 50
50 -
 51
51 -
 52
52 -
 53
53 -
 54
54 -
 55
55 -
 56
56 -
 57
57 -
 58
58 -
 59
59 -
 60
60 -
 61
61 -
62
-
63
-
64
-
65
-
66
-
67
-
68
-
69
-
70
-
71
-
72
-
73
-
74
-
75
-
76
-
77
-
78
-
79
-
80
-
81
-
82
-
83
-
84
-
85
-
86
-
87
-
88
-
89
-
90
-
91
-
92
-
93
-
94
-
95
-
96
-
97
-
98
-
99
-
100
-
101
-
102
-
103
-
104
-
105
-
106
-
107
-
108
-
109
-
110
-
111
-
112
-
113
-
114
-
115
-
116
-
117
-
118
-
119
-
120
-
121
-
122
-
123
-
124
-
125
-
126
-
127
-
128
-
129
-
130
-
131
-
132
-
133
-
134
-
135
-
136
-
137
-
138
-
139
-
140
-
141
-
142
-
143
-
144
-
145
-
146
-
147
-
148
-
149
-
150
-
151
-
152
-
153
-
154
-
155
-
156
-
157
-
158
-
159
-
160
-
161
-
162
-
163
-
164
-
165
-
166
-
167
-
168
-
169
-
170
-
171
-
172
-
173
-
174
-
175
-
176
-
177
-
178
-
179
-
180
-
181
-
182
-
183
-
184
-
185
-
186
-
187
-
188
-
189
-
190
-
191
-
192
-
193
-
194
-
195
-
196
-
197
-
198
-
199
-
200
-
201
-
202
-
203
-
204
-
205
 |
 |

Table of Contents
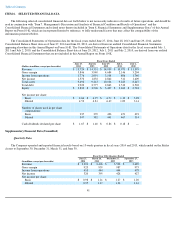
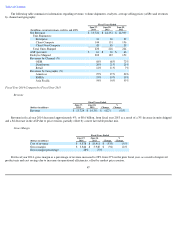
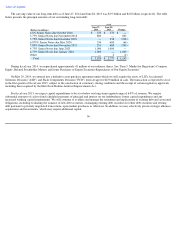
The following table summarizes information regarding revenue, volume shipments, exabytes, average selling prices (ASPs) and revenues
by channel and geography:
Fiscal Year 2014 Compared to Fiscal Year 2013
Revenue
Revenue in fiscal year 2014 decreased approximately 4%, or $0.6 billion, from fiscal year 2013 as a result of a 3% decrease in units shipped
and a $2 decrease in the ASP due to price erosion, partially offset by a more favorable product mix.
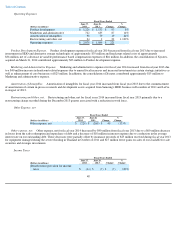
Gross Margin
For fiscal year 2014, gross margin as a percentage of revenue increased to 28% from 27% in the prior fiscal year, as a result of improved
product mix and cost savings due to increases in operational efficiencies, offset by modest price erosion.
47
Fiscal Years Ended
(In millions, except percentages, exabytes and ASPs)
June 27,
2014
June 28,
2013
June 29,
2012
Net Revenue
$
13,724
$
14,351
$
14,939
Unit Shipments:
Enterprise
31
30
29
Client Compute
144
151
156
Client Non
-
Compute
45
45
39
1
1
1
1
1
1
1
1
Total Units Shipped
220
226
224
ASP (per unit)
$
61
$
63
$
66
Exabytes Shipped
202
185
150
Revenues by Channel (%)
OEM
68
%
68
%
72
%
Distributors
20
%
21
%
21
%
Retail
12
%
11
%
7
%
Revenues by Geography (%)
Americas
27
%
27
%
26
%
EMEA
19
%
19
%
19
%
Asia Pacific
54
%
54
%
55
%
Fiscal Years Ended
(Dollars in millions)
June 27,
2014
June 28,
2013
Change
%
Change
Revenue
$
13,724
$
14,351
$
(627
)
(4
)%
Fiscal Years Ended
(Dollars in millions)
June 27,
2014
June 28,
2013
Change
%
Change
Cost of revenue
$
9,878
$
10,411
$
(533
)
(5
)%
Gross margin
$
3,846
$
3,940
$
(94
)
(2
)%
Gross margin percentage
28
%
27
%