Seagate 2013 Annual Report Download - page 70
Download and view the complete annual report
Please find page 70 of the 2013 Seagate annual report below. You can navigate through the pages in the report by either clicking on the pages listed below, or by using the keyword search tool below to find specific information within the annual report.-
 1
1 -
2
-
3
-
4
-
5
-
6
-
7
-
8
-
9
-
10
-
11
-
12
-
13
-
14
-
15
-
16
-
17
-
18
-
19
-
20
-
21
-
22
-
23
-
24
-
25
-
26
-
27
-
28
-
29
-
30
-
31
-
32
-
33
-
34
-
35
-
36
-
37
-
38
-
39
-
40
-
41
-
42
-
43
-
44
-
45
-
46
-
47
-
48
-
49
-
50
-
51
-
52
-
53
-
54
-
55
-
56
-
57
-
58
-
59
-
 60
60 -
 61
61 -
 62
62 -
 63
63 -
 64
64 -
 65
65 -
 66
66 -
 67
67 -
 68
68 -
 69
69 -
 70
70 -
 71
71 -
 72
72 -
 73
73 -
 74
74 -
 75
75 -
 76
76 -
 77
77 -
 78
78 -
 79
79 -
 80
80 -
81
-
82
-
83
-
84
-
85
-
86
-
87
-
88
-
89
-
90
-
91
-
92
-
93
-
94
-
95
-
96
-
97
-
98
-
99
-
100
-
101
-
102
-
103
-
104
-
105
-
106
-
107
-
108
-
109
-
110
-
111
-
112
-
113
-
114
-
115
-
116
-
117
-
118
-
119
-
120
-
121
-
122
-
123
-
124
-
125
-
126
-
127
-
128
-
129
-
130
-
131
-
132
-
133
-
134
-
135
-
136
-
137
-
138
-
139
-
140
-
141
-
142
-
143
-
144
-
145
-
146
-
147
-
148
-
149
-
150
-
151
-
152
-
153
-
154
-
155
-
156
-
157
-
158
-
159
-
160
-
161
-
162
-
163
-
164
-
165
-
166
-
167
-
168
-
169
-
170
-
171
-
172
-
173
-
174
-
175
-
176
-
177
-
178
-
179
-
180
-
181
-
182
-
183
-
184
-
185
-
186
-
187
-
188
-
189
-
190
-
191
-
192
-
193
-
194
-
195
-
196
-
197
-
198
-
199
-
200
-
201
-
202
-
203
-
204
-
205
 |
 |

Table of Contents
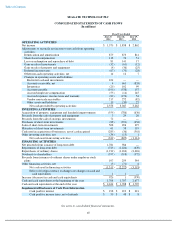
SEAGATE TECHNOLOGY PLC
CONSOLIDATED STATEMENTS OF CASH FLOWS
(In millions)
See notes to consolidated financial statements.
65
Fiscal Years Ended
June 27,
2014
June 28,
2013
June 29,
2012
OPERATING ACTIVITIES
Net income
$
1,570
$
1,838
$
2,862
Adjustments to reconcile net income to net cash from operating
activities:
Depreciation and amortization
879
873
814
Share
-
based compensation
118
76
51
Loss on redemption and repurchase of debt
81
141
17
Gain on sale of investments
(32
)
(61
)
(12
)
Gain on sale of property and equipment
(4
)
(36
)
(25
)
Deferred income taxes
(67
)
(70
)
(28
)
Other non
-
cash operating activities, net
14
12
7
Changes in operating assets and liabilities:
Restricted cash and investments
104
—
—
Accounts receivable, net
4
661
(824
)
Inventories
(20
)
102
99
Accounts payable
(190
)
(538
)
157
Accrued employee compensation
(55
)
(14
)
145
Accrued expenses, income taxes and warranty
(80
)
(170
)
54
Vendor non
-
trade receivables
217
272
(82
)
Other assets and liabilities
19
(39
)
27
1
1
1
1
1
1
1
1
Net cash provided by operating activities
2,558
3,047
3,262
INVESTING ACTIVITIES
Acquisition of property, equipment and leasehold improvements
(559
)
(786
)
(636
)
Proceeds from the sale of property and equipment
3
29
20
Proceeds from the sale of strategic investments
72
—
—
Purchases of short
-
term investments
(88
)
(351
)
(454
)
Sales of short
-
term investments
508
296
397
Maturities of short
-
term investments
61
38
119
Cash used in acquisition of businesses, net of cash acquired
(285
)
(36
)
(561
)
Other investing activities, net
(34
)
(15
)
1
1
1
1
1
1
1
1
1
Net cash used in investing activities
(322
)
(825
)
(1,114
)
1
1
1
1
1
1
1
1
FINANCING ACTIVITIES
Net proceeds from issuance of long
-
term debt
1,781
986
—
Repayments of long
-
term debt
(725
)
(1,224
)
(670
)
Repurchases of ordinary shares
(1,912
)
(1,654
)
(2,426
)
Dividends to shareholders
(557
)
(518
)
(372
)
Proceeds from issuance of ordinary shares under employee stock
plans
107
259
344
Other financing activities, net
(5
)
(71
)
6
1
1
1
1
1
1
1
1
Net cash used in financing activities
(1,311
)
(2,222
)
(3,118
)
1
1
1
1
1
1
1
1
Effect of foreign currency exchange rate changes on cash and
cash equivalents
1
1
—
1
1
1
1
1
1
1
1
Increase (decrease) in cash and cash equivalents
926
1
(970
)
Cash and cash equivalents at the beginning of the year
1,708
1,707
2,677
1
1
1
1
1
1
1
1
Cash and cash equivalents at the end of the year
$
2,634
$
1,708
$
1,707
1
1
1
1
1
1
1
1
1
1
1
1
1
1
1
1
Supplemental Disclosure of Cash Flow Information
Cash paid for interest
$
198
$
219
$
221
Cash paid for income taxes, net of refunds
$
50
$
48
$
8