Seagate 2013 Annual Report Download - page 104
Download and view the complete annual report
Please find page 104 of the 2013 Seagate annual report below. You can navigate through the pages in the report by either clicking on the pages listed below, or by using the keyword search tool below to find specific information within the annual report.-
 1
1 -
2
-
3
-
4
-
5
-
6
-
7
-
8
-
9
-
10
-
11
-
12
-
13
-
14
-
15
-
16
-
17
-
18
-
19
-
20
-
21
-
22
-
23
-
24
-
25
-
26
-
27
-
28
-
29
-
30
-
31
-
32
-
33
-
34
-
35
-
36
-
37
-
38
-
39
-
40
-
41
-
42
-
43
-
44
-
45
-
46
-
47
-
48
-
49
-
50
-
51
-
52
-
53
-
54
-
55
-
56
-
57
-
58
-
59
-
60
-
61
-
62
-
63
-
64
-
65
-
66
-
67
-
68
-
69
-
70
-
71
-
72
-
73
-
74
-
75
-
76
-
77
-
78
-
79
-
80
-
81
-
82
-
83
-
84
-
85
-
86
-
87
-
88
-
89
-
90
-
91
-
92
-
93
-
 94
94 -
 95
95 -
 96
96 -
 97
97 -
 98
98 -
 99
99 -
 100
100 -
 101
101 -
 102
102 -
 103
103 -
 104
104 -
 105
105 -
 106
106 -
 107
107 -
 108
108 -
 109
109 -
 110
110 -
 111
111 -
 112
112 -
 113
113 -
 114
114 -
115
-
116
-
117
-
118
-
119
-
120
-
121
-
122
-
123
-
124
-
125
-
126
-
127
-
128
-
129
-
130
-
131
-
132
-
133
-
134
-
135
-
136
-
137
-
138
-
139
-
140
-
141
-
142
-
143
-
144
-
145
-
146
-
147
-
148
-
149
-
150
-
151
-
152
-
153
-
154
-
155
-
156
-
157
-
158
-
159
-
160
-
161
-
162
-
163
-
164
-
165
-
166
-
167
-
168
-
169
-
170
-
171
-
172
-
173
-
174
-
175
-
176
-
177
-
178
-
179
-
180
-
181
-
182
-
183
-
184
-
185
-
186
-
187
-
188
-
189
-
190
-
191
-
192
-
193
-
194
-
195
-
196
-
197
-
198
-
199
-
200
-
201
-
202
-
203
-
204
-
205
 |
 |

Table of Contents
SEAGATE TECHNOLOGY PLC
NOTES TO CONSOLIDATED FINANCIAL STATEMENTS—(Continued)
Items Measured at Fair Value on a Non-Recurring Basis
The Company enters into certain strategic investments for the promotion of business and strategic objectives. Strategic investments in
equity securities where the Company does not have the ability to exercise significant influence over the investees, included in Other assets, net in
the Consolidated Balance Sheets, are recorded at cost and are periodically analyzed to determine whether or not there are indicators of
impairment. The carrying value of the Company's strategic investments at June 27, 2014 and June 28, 2013 totaled $46 million and $66 million,
respectively, and consisted primarily of privately held equity securities without a readily determinable fair value.
During the fiscal years 2014, 2013 and 2012, the Company determined that certain of its equity investments accounted for under the cost
method were other-than-temporarily impaired, and recognized charges of $2 million, $5 million and $7 million, respectively, in order to write
down the carrying amount of the investment to its estimated fair value. These amounts were recorded in Other, net in the Consolidated
Statements of Operations. Since there was no active market for the equity securities of the investee, the Company estimated fair value of the
investee by using the market approach, which was then used to estimate the applicable portion of the fair value of its underlying intellectual
property assets.
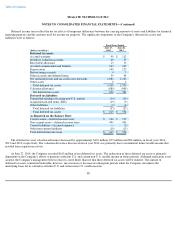
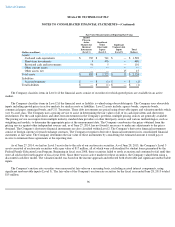
Other Fair Value Disclosures
The Company's debt is carried at amortized cost. The fair value of the Company's debt is derived using the closing price of the same debt
instruments as of the date of valuation, which takes into account the yield curve, interest rates, and other observable inputs. Accordingly, these
fair value measurements are categorized as Level 2. The following table presents the fair value and amortized cost of the Company's debt in
order of maturity:
10. Shareholders' Equity
Share Capital
The Company's authorized share capital is $13,500 and consists of 1,250,000,000 ordinary shares, par value $0.00001, of which
326,539,322 shares were outstanding as of June 27, 2014, and 100,000,000 preferred shares, par value $0.00001, of which none were issued or
outstanding as of June 27, 2014.
97
June 27, 2014
June 28, 2013
(Dollars in millions)
Carrying
Amount
Estimated
Fair Value
Carrying
Amount
Estimated
Fair Value
6.8% Senior Notes due October 2016
$
335
$
374
$
335
$
370
3.75% Senior Notes due November 2018
800
820
—
—
7.75% Senior Notes due December 2018
—
—
238
259
6.875% Senior Notes due May 2020
534
578
600
644
7.00% Senior Notes due November 2021
251
284
600
645
4.75% Senior Notes due June 2023
1,000
1,009
1,000
938
4.75% Senior Notes due January 2025
1,000
995
—
—
Other
—
—
4
4
1
1
1
1
1
1
1
1
1
1
3,920
4,060
2,777
2,860
Less short-term borrowings and current portion of
long
-
term debt
—
—
(
3
)
(3
)
Long
-
term debt, less current portion
$
3,920
$
4,060
$
2,774
$
2,857
1
1
1
1
1
1
1
1
1
1
1
1
1
1
1
1
1
1
1
1