Seagate 2013 Annual Report Download - page 101
Download and view the complete annual report
Please find page 101 of the 2013 Seagate annual report below. You can navigate through the pages in the report by either clicking on the pages listed below, or by using the keyword search tool below to find specific information within the annual report.-
 1
1 -
2
-
3
-
4
-
5
-
6
-
7
-
8
-
9
-
10
-
11
-
12
-
13
-
14
-
15
-
16
-
17
-
18
-
19
-
20
-
21
-
22
-
23
-
24
-
25
-
26
-
27
-
28
-
29
-
30
-
31
-
32
-
33
-
34
-
35
-
36
-
37
-
38
-
39
-
40
-
41
-
42
-
43
-
44
-
45
-
46
-
47
-
48
-
49
-
50
-
51
-
52
-
53
-
54
-
55
-
56
-
57
-
58
-
59
-
60
-
61
-
62
-
63
-
64
-
65
-
66
-
67
-
68
-
69
-
70
-
71
-
72
-
73
-
74
-
75
-
76
-
77
-
78
-
79
-
80
-
81
-
82
-
83
-
84
-
85
-
86
-
87
-
88
-
89
-
90
-
 91
91 -
 92
92 -
 93
93 -
 94
94 -
 95
95 -
 96
96 -
 97
97 -
 98
98 -
 99
99 -
 100
100 -
 101
101 -
 102
102 -
 103
103 -
 104
104 -
 105
105 -
 106
106 -
 107
107 -
 108
108 -
 109
109 -
 110
110 -
 111
111 -
112
-
113
-
114
-
115
-
116
-
117
-
118
-
119
-
120
-
121
-
122
-
123
-
124
-
125
-
126
-
127
-
128
-
129
-
130
-
131
-
132
-
133
-
134
-
135
-
136
-
137
-
138
-
139
-
140
-
141
-
142
-
143
-
144
-
145
-
146
-
147
-
148
-
149
-
150
-
151
-
152
-
153
-
154
-
155
-
156
-
157
-
158
-
159
-
160
-
161
-
162
-
163
-
164
-
165
-
166
-
167
-
168
-
169
-
170
-
171
-
172
-
173
-
174
-
175
-
176
-
177
-
178
-
179
-
180
-
181
-
182
-
183
-
184
-
185
-
186
-
187
-
188
-
189
-
190
-
191
-
192
-
193
-
194
-
195
-
196
-
197
-
198
-
199
-
200
-
201
-
202
-
203
-
204
-
205
 |
 |

Table of Contents
SEAGATE TECHNOLOGY PLC
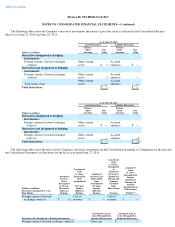
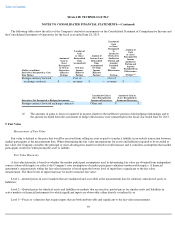
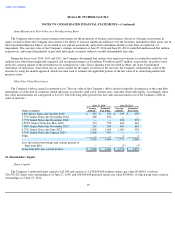
NOTES TO CONSOLIDATED FINANCIAL STATEMENTS—(Continued)
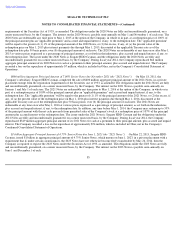
The Company considers an active market to be one in which transactions for the asset or liability occur with sufficient frequency and
volume to provide pricing information on an ongoing basis, and views an inactive market as one in which there are few transactions for the asset
or liability, the prices are not current, or price quotations vary substantially either over time or among market makers. Where appropriate the
Company's or the counterparty's non-performance risk is considered in determining the fair values of liabilities and assets, respectively.
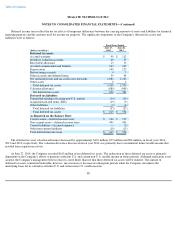
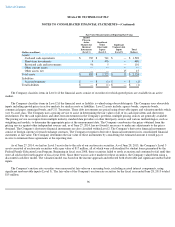
Items Measured at Fair Value on a Recurring Basis
The following table presents the Company's assets and liabilities that are measured at fair value on a recurring basis, excluding accrued
interest components, as of June 27, 2014:
94
Fair Value Measurements at Reporting Date Using
(Dollars in millions)
Quoted
Prices in
Active
Markets for
Identical
Instruments
(Level 1)
Significant
Other
Observable
Inputs
(Level 2)
Significant
Unobservable
Inputs
(Level 3)
Total
Balance
Assets:
Money market funds
$
793
$
—
$
—
$
793
Commercial paper
—
1,261
—
1,261
U.S. treasuries and agency bonds
—
—
—
—
Certificates of deposit
—
269
—
269
Corporate bonds
—
6
—
6
Other debt securities
—
—
—
—
Equity securities
—
—
—
—
1
1
1
1
1
1
1
1
1
1
Total cash equivalents and short-term
investments
793
1,536
—
2,329
1
1
1
1
1
1
1
1
1
1
Restricted cash and investments:
Mutual Funds
—
—
—
—
Other debt securities
—
4
—
4
Auction rate securities
—
—
—
—
Derivative assets
—
5
—
5
1
1
1
1
1
1
1
1
1
1
Total assets
$
793
$
1,545
$
—
$
2,338
1
1
1
1
1
1
1
1
1
1
1
1
1
1
1
1
1
1
1
1
Liabilities:
Derivative liabilities
$
—
$
—
$
—
$
—
Total return swap
—
—
—
—
1
1
1
1
1
1
1
1
1
1
Total liabilities
$
—
$
—
$
—
$
—
1
1
1
1
1
1
1
1
1
1