Seagate 2013 Annual Report Download - page 50
Download and view the complete annual report
Please find page 50 of the 2013 Seagate annual report below. You can navigate through the pages in the report by either clicking on the pages listed below, or by using the keyword search tool below to find specific information within the annual report.-
 1
1 -
2
-
3
-
4
-
5
-
6
-
7
-
8
-
9
-
10
-
11
-
12
-
13
-
14
-
15
-
16
-
17
-
18
-
19
-
20
-
21
-
22
-
23
-
24
-
25
-
26
-
27
-
28
-
29
-
30
-
31
-
32
-
33
-
34
-
35
-
36
-
37
-
38
-
39
-
 40
40 -
 41
41 -
 42
42 -
 43
43 -
 44
44 -
 45
45 -
 46
46 -
 47
47 -
 48
48 -
 49
49 -
 50
50 -
 51
51 -
 52
52 -
 53
53 -
 54
54 -
 55
55 -
 56
56 -
 57
57 -
 58
58 -
 59
59 -
 60
60 -
61
-
62
-
63
-
64
-
65
-
66
-
67
-
68
-
69
-
70
-
71
-
72
-
73
-
74
-
75
-
76
-
77
-
78
-
79
-
80
-
81
-
82
-
83
-
84
-
85
-
86
-
87
-
88
-
89
-
90
-
91
-
92
-
93
-
94
-
95
-
96
-
97
-
98
-
99
-
100
-
101
-
102
-
103
-
104
-
105
-
106
-
107
-
108
-
109
-
110
-
111
-
112
-
113
-
114
-
115
-
116
-
117
-
118
-
119
-
120
-
121
-
122
-
123
-
124
-
125
-
126
-
127
-
128
-
129
-
130
-
131
-
132
-
133
-
134
-
135
-
136
-
137
-
138
-
139
-
140
-
141
-
142
-
143
-
144
-
145
-
146
-
147
-
148
-
149
-
150
-
151
-
152
-
153
-
154
-
155
-
156
-
157
-
158
-
159
-
160
-
161
-
162
-
163
-
164
-
165
-
166
-
167
-
168
-
169
-
170
-
171
-
172
-
173
-
174
-
175
-
176
-
177
-
178
-
179
-
180
-
181
-
182
-
183
-
184
-
185
-
186
-
187
-
188
-
189
-
190
-
191
-
192
-
193
-
194
-
195
-
196
-
197
-
198
-
199
-
200
-
201
-
202
-
203
-
204
-
205
 |
 |

Table of Contents
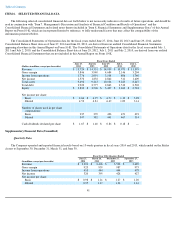
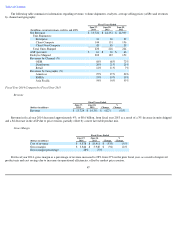
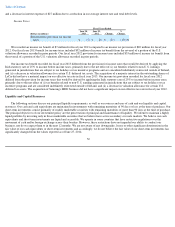
Results of Operations
We list in the table below summarized information from our consolidated statements of operations by dollars and as a percentage of
revenue:
46
Fiscal Years Ended
(Dollars in millions)
June 27,
2014
June 28,
2013
June 29,
2012
Revenue
$
13,724
$
14,351
$
14,939
Cost of revenue
9,878
10,411
10,255
1
1
1
1
1
1
1
1
Gross margin
3,846
3,940
4,684
Product development
1,226
1,133
1,006
Marketing and administrative
722
635
528
Amortization of intangibles
98
79
38
Restructuring and other, net
24
2
4
1
1
1
1
1
1
1
1
Income from operations
1,776
2,091
3,108
Other expense, net
(220
)
(260
)
(226
)
1
1
1
1
1
1
1
1
Income before income taxes
1,556
1,831
2,882
(Benefit from) provision for income taxes
(14
)
(7
)
20
1
1
1
1
1
1
1
1
Net income
$
1,570
$
1,838
$
2,862
1
1
1
1
1
1
1
1
1
1
1
1
1
1
1
1
Fiscal Years Ended
(as a percentage of Revenue)
June 27,
2014
June 28,
2013
June 29,
2012
Revenue
100
%
100
%
100
%
Cost of revenue
72
73
69
Gross margin
28
27
31
Product development
9
8
7
Marketing and administrative
5
4
4
Amortization of intangibles
1
1
—
Restructuring and other, net
—
—
—
1
1
1
1
1
1
1
1
Income from operations
13
14
21
Other expense, net
(2
)
(2
)
(2
)
Income before income taxes
11
12
19
(Benefit from) provision for income taxes
—
—
—
1
1
1
1
1
1
1
1
Net income
11
%
12
%
19
%
1
1
1
1
1
1
1
1