Seagate 2013 Annual Report Download - page 55
Download and view the complete annual report
Please find page 55 of the 2013 Seagate annual report below. You can navigate through the pages in the report by either clicking on the pages listed below, or by using the keyword search tool below to find specific information within the annual report.-
 1
1 -
2
-
3
-
4
-
5
-
6
-
7
-
8
-
9
-
10
-
11
-
12
-
13
-
14
-
15
-
16
-
17
-
18
-
19
-
20
-
21
-
22
-
23
-
24
-
25
-
26
-
27
-
28
-
29
-
30
-
31
-
32
-
33
-
34
-
35
-
36
-
37
-
38
-
39
-
40
-
41
-
42
-
43
-
44
-
 45
45 -
 46
46 -
 47
47 -
 48
48 -
 49
49 -
 50
50 -
 51
51 -
 52
52 -
 53
53 -
 54
54 -
 55
55 -
 56
56 -
 57
57 -
 58
58 -
 59
59 -
 60
60 -
 61
61 -
 62
62 -
 63
63 -
 64
64 -
 65
65 -
66
-
67
-
68
-
69
-
70
-
71
-
72
-
73
-
74
-
75
-
76
-
77
-
78
-
79
-
80
-
81
-
82
-
83
-
84
-
85
-
86
-
87
-
88
-
89
-
90
-
91
-
92
-
93
-
94
-
95
-
96
-
97
-
98
-
99
-
100
-
101
-
102
-
103
-
104
-
105
-
106
-
107
-
108
-
109
-
110
-
111
-
112
-
113
-
114
-
115
-
116
-
117
-
118
-
119
-
120
-
121
-
122
-
123
-
124
-
125
-
126
-
127
-
128
-
129
-
130
-
131
-
132
-
133
-
134
-
135
-
136
-
137
-
138
-
139
-
140
-
141
-
142
-
143
-
144
-
145
-
146
-
147
-
148
-
149
-
150
-
151
-
152
-
153
-
154
-
155
-
156
-
157
-
158
-
159
-
160
-
161
-
162
-
163
-
164
-
165
-
166
-
167
-
168
-
169
-
170
-
171
-
172
-
173
-
174
-
175
-
176
-
177
-
178
-
179
-
180
-
181
-
182
-
183
-
184
-
185
-
186
-
187
-
188
-
189
-
190
-
191
-
192
-
193
-
194
-
195
-
196
-
197
-
198
-
199
-
200
-
201
-
202
-
203
-
204
-
205
 |
 |

Table of Contents
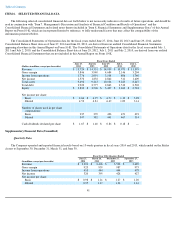
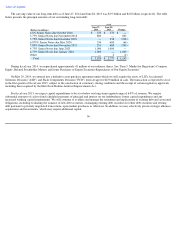
Gross Margin
For fiscal year 2013, gross margin as a percentage of revenue decreased to 27% from 31% in the prior fiscal year, as a result of higher ASPs
during fiscal year 2012. Our ASPs during fiscal year 2012 were increased due to the limited industry supply of hard drives as a result of the
severe flooding in Thailand.
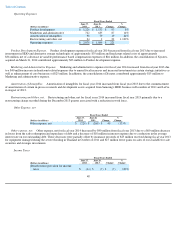
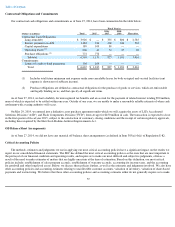
Operating Expenses
Product Development Expense. Product development expenses for fiscal year 2013 increased from fiscal year 2012, primarily due to
increased investments in HDD and alternative storage technologies of approximately $84 million, and headcount related costs of approximately
$41 million, net of a decrease in variable performance based compensation of approximately $7 million.
Marketing and Administrative Expense. Marketing and administrative expenses for fiscal year 2013 increased from fiscal year 2012
primarily due to further investments in certain strategic initiatives as well as enhancement of our core business operations. This, along with our
annual focal increases, resulted in additional headcount related costs of $64 million, net of a reduction in variable performance based
compensation of $7 million. In addition, the consolidation of LaCie in fiscal year 2013 contributed approximately $32 million to Marketing and
administrative expense.
Amortization of Intangibles. Amortization of intangibles for fiscal year 2013 increased as a result of the acquisition of Samsung's HDD
business in December of 2011, and LaCie in August of 2012.
Restructuring and Other, net. Restructuring and other, net for fiscal years 2013 and 2012, was not material and primarily related to
previously announced restructuring plans.
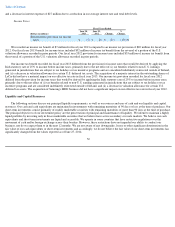
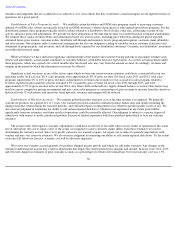
Other Expense, net
Other expense, net for fiscal year 2013 compared to fiscal year 2012 increased due to a loss of $141 million on the early redemption and
repurchase of debt. These losses were partially offset by gains recorded for sales of our available for sale securities and strategic investments of
$61 million, insurance proceeds of $25 million for equipment damaged during the severe flooding in Thailand in October of 2011,
51
Fiscal Years Ended
(Dollars in millions)
June 28,
2013
June 29,
2012
Change
%
Change
Cost of revenue
$
10,411
$
10,255
$
156
2
%
Gross margin
$
3,940
$
4,684
$
(744
)
(16
)%
Gross margin percentage
27
%
31
%
Fiscal Years Ended
(Dollars in millions)
June 28,
2013
June 29,
2012
Change
%
Change
Product development
$
1,133
$
1,006
$
127
13
%
Marketing and administrative
635
528
107
20
%
Amortization of intangibles
79
38
41
108
%
Restructuring and other, net
2
4
(2
)
(50
)%
1
1
1
1
1
1
1
1
1
1
Operating expenses
$
1,849
$
1,576
$
273
1
1
1
1
1
1
1
1
1
1
1
1
1
1
1
1
1
1
1
1
Fiscal Years Ended
(Dollars in millions)
June 28,
2013
June 29,
2012
Change
%
Change
Other expense, net
$
(260
)
$
(226
)
$
(34
)
15
%