Seagate 2013 Annual Report Download - page 62
Download and view the complete annual report
Please find page 62 of the 2013 Seagate annual report below. You can navigate through the pages in the report by either clicking on the pages listed below, or by using the keyword search tool below to find specific information within the annual report.-
 1
1 -
2
-
3
-
4
-
5
-
6
-
7
-
8
-
9
-
10
-
11
-
12
-
13
-
14
-
15
-
16
-
17
-
18
-
19
-
20
-
21
-
22
-
23
-
24
-
25
-
26
-
27
-
28
-
29
-
30
-
31
-
32
-
33
-
34
-
35
-
36
-
37
-
38
-
39
-
40
-
41
-
42
-
43
-
44
-
45
-
46
-
47
-
48
-
49
-
50
-
51
-
 52
52 -
 53
53 -
 54
54 -
 55
55 -
 56
56 -
 57
57 -
 58
58 -
 59
59 -
 60
60 -
 61
61 -
 62
62 -
 63
63 -
 64
64 -
 65
65 -
 66
66 -
 67
67 -
 68
68 -
 69
69 -
 70
70 -
 71
71 -
 72
72 -
73
-
74
-
75
-
76
-
77
-
78
-
79
-
80
-
81
-
82
-
83
-
84
-
85
-
86
-
87
-
88
-
89
-
90
-
91
-
92
-
93
-
94
-
95
-
96
-
97
-
98
-
99
-
100
-
101
-
102
-
103
-
104
-
105
-
106
-
107
-
108
-
109
-
110
-
111
-
112
-
113
-
114
-
115
-
116
-
117
-
118
-
119
-
120
-
121
-
122
-
123
-
124
-
125
-
126
-
127
-
128
-
129
-
130
-
131
-
132
-
133
-
134
-
135
-
136
-
137
-
138
-
139
-
140
-
141
-
142
-
143
-
144
-
145
-
146
-
147
-
148
-
149
-
150
-
151
-
152
-
153
-
154
-
155
-
156
-
157
-
158
-
159
-
160
-
161
-
162
-
163
-
164
-
165
-
166
-
167
-
168
-
169
-
170
-
171
-
172
-
173
-
174
-
175
-
176
-
177
-
178
-
179
-
180
-
181
-
182
-
183
-
184
-
185
-
186
-
187
-
188
-
189
-
190
-
191
-
192
-
193
-
194
-
195
-
196
-
197
-
198
-
199
-
200
-
201
-
202
-
203
-
204
-
205
 |
 |

Table of Contents
estimates and judgments that are as difficult or as subjective, or it is less likely that they would have a material impact on our reported results of
operations for a given period.
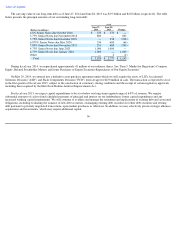
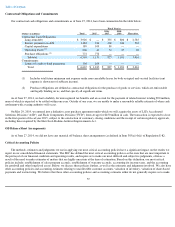
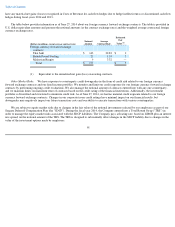
Establishment of Sales Program Accruals. We establish certain distributor and OEM sales programs aimed at increasing customer
demand. For OEM sales, rebates are typically based on an OEM customer's volume of purchases or other agreed upon rebate programs. For the
distribution channel, these programs typically involve rebates related to a distributor's level of sales, order size, advertising or point of sale
activity and price protection adjustments. We provide for these obligations at the time that revenue is recorded based on estimated requirements.
We estimate these contra-revenue rebates and adjustments based on various factors, including price reductions during the period reported,
estimated future price erosion, customer orders, distributor sell-through and inventory levels, program participation, customer claim submittals
and sales returns. Our estimates reflect contractual arrangements but also our judgment relating to variables such as customer claim rates and
attainment of program goals, and inventory and sell-
through levels reported by our distribution customers. Currently, our distributors' inventories
are within the historical range.
While we believe we have sufficient experience and knowledge of the market and customer buying patterns to reasonably estimate such
rebates and adjustments, actual market conditions or customer behavior could differ from our expectations. As a result, actual payments under
these programs, which may spread over several months after the related sale, may vary from the amount accrued. Accordingly, revenues and
margins in the period in which the adjustment occurs may be affected.
Significant actual variations in any of the factors upon which we base our contra-revenue estimates could have a material effect on our
operating results. In fiscal year 2014, sales programs were approximately 8% of gross revenue. For fiscal years 2013 and 2012, total sales
programs ranged from 2% to 10% of gross revenues. Adjustments to revenues due to under or over accruals for sales programs related to
revenues reported in prior quarterly periods averaged 0.3% of quarterly gross revenue for fiscal years 2012 through 2013, and were
approximately 0.5% of gross revenue in fiscal year 2014. Any future shifts in the industry supply-demand balance as well as other factors may
result in a more competitive pricing environment and may cause sales programs as a percentage of gross revenue to increase from the current or
historical levels. If such rebates and incentives trend upwards, revenues and margins will be reduced.
Establishment of Warranty Accruals. We estimate probable product warranty costs at the time revenue is recognized. We generally
warrant our products for a period of 1 to 5 years. Our warranty provision considers estimated product failure rates and trends (including the
timing of product returns during the warranty periods), and estimated repair or replacement costs related to product quality issues, if any. We
also exercise judgment in estimating our ability to sell certain repaired disk drives. Should actual experience in any future period differ
significantly from our estimates, our future results of operations could be materially affected. Our judgment is subject to a greater degree of
subjectivity with respect to newly introduced products because of limited experience with those products upon which to base our warranty
estimates.
The actual results with regard to warranty expenditures could have an adverse or favorable effect on our results of operations if the actual
rate of unit failure, the cost to repair a unit, or the actual cost required to satisfy customer claims differs from those estimates we used in
determining the warranty accrual. Since we typically outsource our warranty repairs, our repair cost is subject to periodic negotiations with
vendors and may vary from our estimates. We also exercise judgment in estimating our ability to sell certain repaired disk drives. To the extent
such sales fall below our forecast, warranty cost will be adversely impacted.
We review our warranty accrual quarterly for products shipped in prior periods and which are still under warranty. Any changes in the
estimates underlying the accrual may result in adjustments that impact the current period gross margins and income. In fiscal years 2014, 2013
and 2012 net changes in estimates of prior warranty accruals as a percentage of revenue were immaterial. Our total warranty cost was 1.3%,
58