Seagate 2013 Annual Report Download - page 57
Download and view the complete annual report
Please find page 57 of the 2013 Seagate annual report below. You can navigate through the pages in the report by either clicking on the pages listed below, or by using the keyword search tool below to find specific information within the annual report.-
 1
1 -
2
-
3
-
4
-
5
-
6
-
7
-
8
-
9
-
10
-
11
-
12
-
13
-
14
-
15
-
16
-
17
-
18
-
19
-
20
-
21
-
22
-
23
-
24
-
25
-
26
-
27
-
28
-
29
-
30
-
31
-
32
-
33
-
34
-
35
-
36
-
37
-
38
-
39
-
40
-
41
-
42
-
43
-
44
-
45
-
46
-
 47
47 -
 48
48 -
 49
49 -
 50
50 -
 51
51 -
 52
52 -
 53
53 -
 54
54 -
 55
55 -
 56
56 -
 57
57 -
 58
58 -
 59
59 -
 60
60 -
 61
61 -
 62
62 -
 63
63 -
 64
64 -
 65
65 -
 66
66 -
 67
67 -
68
-
69
-
70
-
71
-
72
-
73
-
74
-
75
-
76
-
77
-
78
-
79
-
80
-
81
-
82
-
83
-
84
-
85
-
86
-
87
-
88
-
89
-
90
-
91
-
92
-
93
-
94
-
95
-
96
-
97
-
98
-
99
-
100
-
101
-
102
-
103
-
104
-
105
-
106
-
107
-
108
-
109
-
110
-
111
-
112
-
113
-
114
-
115
-
116
-
117
-
118
-
119
-
120
-
121
-
122
-
123
-
124
-
125
-
126
-
127
-
128
-
129
-
130
-
131
-
132
-
133
-
134
-
135
-
136
-
137
-
138
-
139
-
140
-
141
-
142
-
143
-
144
-
145
-
146
-
147
-
148
-
149
-
150
-
151
-
152
-
153
-
154
-
155
-
156
-
157
-
158
-
159
-
160
-
161
-
162
-
163
-
164
-
165
-
166
-
167
-
168
-
169
-
170
-
171
-
172
-
173
-
174
-
175
-
176
-
177
-
178
-
179
-
180
-
181
-
182
-
183
-
184
-
185
-
186
-
187
-
188
-
189
-
190
-
191
-
192
-
193
-
194
-
195
-
196
-
197
-
198
-
199
-
200
-
201
-
202
-
203
-
204
-
205
 |
 |

Table of Contents
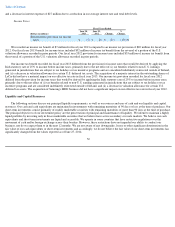
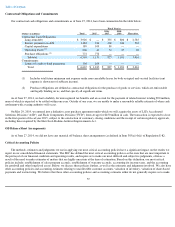
Cash and cash equivalents, short-term investments, and restricted cash and investments
Our cash and cash equivalents, short-term investments and restricted cash and investments increased from June 28, 2013 as a result of net
cash provided by operating activities and the proceeds from the issuance of $800 million of our 3.75% Senior Notes due 2018 and $1 billion of
our 4.75% Senior Notes due 2025. These cash inflows were partially offset by repurchases of our ordinary shares, redemption and repurchase of
certain of our long-term debt, capital expenditures, dividends paid to our shareholders and the acquisition of Xyratex.
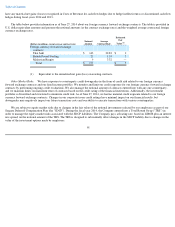
The following table summarizes results from the statement of cash flows for the periods indicated:
Cash Provided by Operating Activities
Cash provided by operating activities for fiscal year 2014 was approximately $2.6 billion and includes the effects of net income adjusted for
non-cash items including depreciation, amortization, stock-based compensation, and:
• a decrease of $217 million in vendor non-trade receivables primarily related to a change in the contractual relationship with some
of our contract manufacturers which reduced the volume of components we sold to them;
• a decrease of $190 million in accounts payable due to a change in the contractual relationship with some of our contract
manufacturers which resulted in a reduction in direct materials purchased and subsequently sold to our contract manufacturers;
and
• a decrease of $104 million in restricted cash and investments primarily due to the restricted cash and investments held in a rabbi
trust being replaced with a standby letter of credit.
Cash provided by operating activities for fiscal year 2013 was approximately $3.0 billion and includes the effects of net income adjusted for
non-cash items including depreciation, amortization, stock-based compensation, and:
• a decrease of $661 million in accounts receivable, net, primarily due to a decrease in revenue in the fourth quarter of fiscal year
2013 compared to the prior year period;
53
As of
(Dollars in millions)
June 27,
2014
June 28,
2013
Change
Cash and cash equivalents
$
2,634
$
1,708
$
926
Short
-
term investments
20
480
(460
)
Restricted cash and investments
4
101
(97
)
1
1
1
1
1
1
1
1
Total
$
2,658
$
2,289
$
369
1
1
1
1
1
1
1
1
1
1
1
1
1
1
1
1
Fiscal Years Ended
(Dollars in millions)
June 27,
2014
June 28,
2013
June 29,
2012
Net cash flow provided by (used in):
Operating activities
$
2,558
$
3,047
$
3,262
Investing activities
(322
)
(825
)
(1,114
)
Financing activities
(1,311
)
(2,222
)
(3,118
)
Effect of foreign currency exchange rates
1
1
—
Net increase (decrease) in cash and cash
equivalents
$
926
$
1
$
(970
)
1
1
1
1
1
1
1
1
1
1
1
1
1
1
1
1