Seagate 2013 Annual Report Download - page 103
Download and view the complete annual report
Please find page 103 of the 2013 Seagate annual report below. You can navigate through the pages in the report by either clicking on the pages listed below, or by using the keyword search tool below to find specific information within the annual report.-
 1
1 -
2
-
3
-
4
-
5
-
6
-
7
-
8
-
9
-
10
-
11
-
12
-
13
-
14
-
15
-
16
-
17
-
18
-
19
-
20
-
21
-
22
-
23
-
24
-
25
-
26
-
27
-
28
-
29
-
30
-
31
-
32
-
33
-
34
-
35
-
36
-
37
-
38
-
39
-
40
-
41
-
42
-
43
-
44
-
45
-
46
-
47
-
48
-
49
-
50
-
51
-
52
-
53
-
54
-
55
-
56
-
57
-
58
-
59
-
60
-
61
-
62
-
63
-
64
-
65
-
66
-
67
-
68
-
69
-
70
-
71
-
72
-
73
-
74
-
75
-
76
-
77
-
78
-
79
-
80
-
81
-
82
-
83
-
84
-
85
-
86
-
87
-
88
-
89
-
90
-
91
-
92
-
 93
93 -
 94
94 -
 95
95 -
 96
96 -
 97
97 -
 98
98 -
 99
99 -
 100
100 -
 101
101 -
 102
102 -
 103
103 -
 104
104 -
 105
105 -
 106
106 -
 107
107 -
 108
108 -
 109
109 -
 110
110 -
 111
111 -
 112
112 -
 113
113 -
114
-
115
-
116
-
117
-
118
-
119
-
120
-
121
-
122
-
123
-
124
-
125
-
126
-
127
-
128
-
129
-
130
-
131
-
132
-
133
-
134
-
135
-
136
-
137
-
138
-
139
-
140
-
141
-
142
-
143
-
144
-
145
-
146
-
147
-
148
-
149
-
150
-
151
-
152
-
153
-
154
-
155
-
156
-
157
-
158
-
159
-
160
-
161
-
162
-
163
-
164
-
165
-
166
-
167
-
168
-
169
-
170
-
171
-
172
-
173
-
174
-
175
-
176
-
177
-
178
-
179
-
180
-
181
-
182
-
183
-
184
-
185
-
186
-
187
-
188
-
189
-
190
-
191
-
192
-
193
-
194
-
195
-
196
-
197
-
198
-
199
-
200
-
201
-
202
-
203
-
204
-
205
 |
 |

Table of Contents
SEAGATE TECHNOLOGY PLC
NOTES TO CONSOLIDATED FINANCIAL STATEMENTS—(Continued)
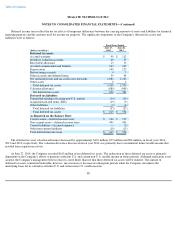
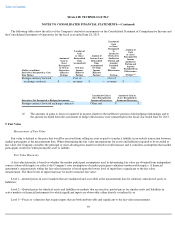
The Company classifies items in Level 1 if the financial assets consist of securities for which quoted prices are available in an active
market.
The Company classifies items in Level 2 if the financial asset or liability is valued using observable inputs. The Company uses observable
inputs including quoted prices in active markets for similar assets or liabilities. Level 2 assets include: agency bonds, corporate bonds,
commercial paper, municipal bonds, and U.S. Treasuries. These debt investments are priced using observable inputs and valuation models which
vary by asset class. The Company uses a pricing service to assist in determining the fair values of all of its cash equivalents and short-term
investments. For the cash equivalents and short-term investments in the Company's portfolio, multiple pricing sources are generally available.
The pricing service uses inputs from multiple industry standard data providers or other third party sources and various methodologies, such as
weighting and models, to determine the appropriate price at the measurement date. The Company corroborates the prices obtained from the
pricing service against other independent sources and, as of June 27, 2014, has not found it necessary to make any adjustments to the prices
obtained. The Company's derivative financial instruments are also classified within Level 2. The Company's derivative financial instruments
consist of foreign currency forward exchange contracts. The Company recognizes derivative financial instruments in its consolidated financial
statements at fair value. The Company determines the fair value of these instruments by considering the estimated amount it would pay or
receive to terminate these agreements at the reporting date.
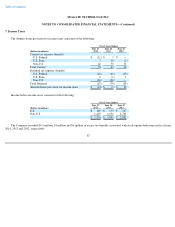
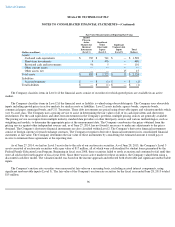
As of June 27, 2014, we had no Level 3 assets due to the sale of our auction rate securities. As of June 28, 2013, the Company's Level 3
assets consisted of auction rate securities with a par value of $17 million, all of which were collateralized by student loans guaranteed by the
Federal Family Education Loan Program. Beginning in fiscal year 2008, these securities failed to settle at auction and continued to fail until they
were all sold in the fourth quarter of fiscal year 2014. Since there was no active market for these securities, the Company valued them using a
discounted cash flow model. The valuation model was based on the income approach and reflected both observable and significant unobservable
inputs.
The Company's auction rate securities were measured at fair value on a recurring basis, excluding accrued interest components, using
significant unobservable inputs (Level 3). The fair value of the Company's auction rate securities for the fiscal year ended June 28, 2013 totaled
$15 million.
96
Fair Value Measurements at Reporting Date Using
(Dollars in millions)
Quoted
Prices in
Active
Markets for
Identical
Instruments
(Level 1)
Significant
Other
Observable
Inputs
(Level 2)
Significant
Unobservable
Inputs
(Level 3)
Total
Balance
Assets:
Cash and cash equivalents
$
787
$
741
$
—
$
1,528
Short
-
term investments
4
476
—
480
Restricted cash and investments
96
5
—
101
Other current assets
—
—
—
—
Other assets, net
—
—
15
15
Total assets
$
887
$
1,222
$
15
$
2,124
1
1
1
1
1
1
1
1
1
1
1
1
1
1
1
1
1
1
1
1
Liabilities:
Accrued expenses
$
—
$
(
1
)
$
—
$
(
1
)
1
1
1
1
1
1
1
1
1
1
Total liabilities
$
—
$
(
1
)
$
—
$
(
1
)
1
1
1
1
1
1
1
1
1
1
1
1
1
1
1
1
1
1
1
1