Seagate 2013 Annual Report Download - page 78
Download and view the complete annual report
Please find page 78 of the 2013 Seagate annual report below. You can navigate through the pages in the report by either clicking on the pages listed below, or by using the keyword search tool below to find specific information within the annual report.-
 1
1 -
2
-
3
-
4
-
5
-
6
-
7
-
8
-
9
-
10
-
11
-
12
-
13
-
14
-
15
-
16
-
17
-
18
-
19
-
20
-
21
-
22
-
23
-
24
-
25
-
26
-
27
-
28
-
29
-
30
-
31
-
32
-
33
-
34
-
35
-
36
-
37
-
38
-
39
-
40
-
41
-
42
-
43
-
44
-
45
-
46
-
47
-
48
-
49
-
50
-
51
-
52
-
53
-
54
-
55
-
56
-
57
-
58
-
59
-
60
-
61
-
62
-
63
-
64
-
65
-
66
-
67
-
 68
68 -
 69
69 -
 70
70 -
 71
71 -
 72
72 -
 73
73 -
 74
74 -
 75
75 -
 76
76 -
 77
77 -
 78
78 -
 79
79 -
 80
80 -
 81
81 -
 82
82 -
 83
83 -
 84
84 -
 85
85 -
 86
86 -
 87
87 -
 88
88 -
89
-
90
-
91
-
92
-
93
-
94
-
95
-
96
-
97
-
98
-
99
-
100
-
101
-
102
-
103
-
104
-
105
-
106
-
107
-
108
-
109
-
110
-
111
-
112
-
113
-
114
-
115
-
116
-
117
-
118
-
119
-
120
-
121
-
122
-
123
-
124
-
125
-
126
-
127
-
128
-
129
-
130
-
131
-
132
-
133
-
134
-
135
-
136
-
137
-
138
-
139
-
140
-
141
-
142
-
143
-
144
-
145
-
146
-
147
-
148
-
149
-
150
-
151
-
152
-
153
-
154
-
155
-
156
-
157
-
158
-
159
-
160
-
161
-
162
-
163
-
164
-
165
-
166
-
167
-
168
-
169
-
170
-
171
-
172
-
173
-
174
-
175
-
176
-
177
-
178
-
179
-
180
-
181
-
182
-
183
-
184
-
185
-
186
-
187
-
188
-
189
-
190
-
191
-
192
-
193
-
194
-
195
-
196
-
197
-
198
-
199
-
200
-
201
-
202
-
203
-
204
-
205
 |
 |

Table of Contents
SEAGATE TECHNOLOGY PLC
NOTES TO CONSOLIDATED FINANCIAL STATEMENTS—(Continued)
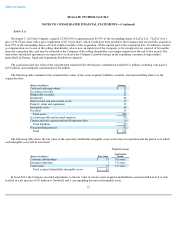
2. Balance Sheet Information
Investments
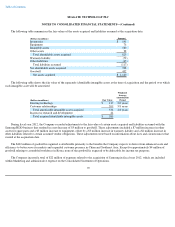
The following table summarizes, by major type, the fair value and amortized cost of the Company's investments as of June 27, 2014:
As of June 27, 2014, the Company's Restricted cash and investments consisted of $4 million in cash and investments held as collateral at
banks for various performance obligations.
During the fourth quarter of 2014, the Company sold all of its auction rate securities and recognized an immaterial loss on the sale which is
included in Other, net in the Company's Consolidated Statement of Operations.
As of June 27, 2014, the Company had no available-for-sale securities that had been in a continuous unrealized loss position for a period
greater than 12 months. The Company determined no available-for-sale securities were other-than-temporarily impaired as of June 27, 2014.
The fair value and amortized cost of the Company's investments classified as available-for-sale at June 27, 2014 by remaining contractual
maturity was as follows:
72
(Dollars in millions)
Amortized
Cost
Unrealized
Gain/(Loss)
Fair
Value
Available
-
for
-
sale securities:
Money market funds
$
793
$
—
$
793
Commercial paper
1,261
—
1,261
Corporate bonds
6
—
6
U.S. treasuries and agency bonds
—
—
—
Certificates of deposit
273
—
273
Auction rate securities
—
—
—
Equity securities
—
—
—
Other debt securities
—
—
—
1
1
1
1
1
1
1
1
2,333
—
2,333
Trading securities
—
—
—
Total
$
2,333
$
—
$
2,333
1
1
1
1
1
1
1
1
1
1
1
1
1
1
1
1
Included in Cash and cash equivalents
$
2,309
Included in Short
-
term investments
20
Included in Restricted cash and investments
4
Included in Other assets, net
—
Total
$
2,333
1
1
1
1
1
1
1
1
1
1
1
1
1
1
1
1
(Dollars in millions)
Amortized
Cost
Fair
Value
Due in less than 1 year
$
2,332
$
2,332
Due in 1 to 5 years
1
1
Due in 5 to 10 years
—
—
Thereafter
—
—
1
1
1
1
1
1
Total
$
2,333
$
2,333
1
1
1
1
1
1
1
1
1
1
1
1