Seagate 2012 Annual Report Download - page 86
Download and view the complete annual report
Please find page 86 of the 2012 Seagate annual report below. You can navigate through the pages in the report by either clicking on the pages listed below, or by using the keyword search tool below to find specific information within the annual report.-
 1
1 -
2
-
3
-
4
-
5
-
6
-
7
-
8
-
9
-
10
-
11
-
12
-
13
-
14
-
15
-
16
-
17
-
18
-
19
-
20
-
21
-
22
-
23
-
24
-
25
-
26
-
27
-
28
-
29
-
30
-
31
-
32
-
33
-
34
-
35
-
36
-
37
-
38
-
39
-
40
-
41
-
42
-
43
-
44
-
45
-
46
-
47
-
48
-
49
-
50
-
51
-
52
-
53
-
54
-
55
-
56
-
57
-
58
-
59
-
60
-
61
-
62
-
63
-
64
-
65
-
66
-
67
-
68
-
69
-
70
-
71
-
72
-
73
-
74
-
75
-
 76
76 -
 77
77 -
 78
78 -
 79
79 -
 80
80 -
 81
81 -
 82
82 -
 83
83 -
 84
84 -
 85
85 -
 86
86 -
 87
87 -
 88
88 -
 89
89 -
 90
90 -
 91
91 -
 92
92 -
 93
93 -
 94
94 -
 95
95 -
 96
96 -
97
-
98
-
99
-
100
-
101
-
102
-
103
-
104
-
105
-
106
-
107
-
108
-
109
-
110
-
111
-
112
-
113
-
114
-
115
-
116
-
117
-
118
-
119
-
120
-
121
-
122
-
123
-
124
-
125
-
126
-
127
-
128
-
129
-
130
-
131
-
132
-
133
-
134
-
135
-
136
-
137
-
138
-
139
-
140
-
141
-
142
-
143
-
144
-
145
-
146
-
147
-
148
-
149
-
150
-
151
-
152
-
153
-
154
-
155
-
156
-
157
-
158
-
159
-
160
-
161
-
162
-
163
-
164
-
165
-
166
-
167
-
168
-
169
-
170
-
171
-
172
-
173
-
174
-
175
-
176
-
177
-
178
-
179
-
180
-
181
-
182
-
183
-
184
-
185
-
186
-
187
-
188
-
189
-
190
-
191
-
192
-
193
-
194
-
195
-
196
-
197
-
198
-
199
-
200
-
201
-
202
-
203
-
204
-
205
-
206
-
207
-
208
-
209
-
210
-
211
-
212
-
213
-
214
-
215
-
216
-
217
-
218
-
219
-
220
-
221
-
222
-
223
 |
 |

Table of Contents
SEAGATE TECHNOLOGY PLC
NOTES TO CONSOLIDATED FINANCIAL STATEMENTS—(Continued)
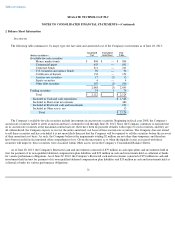
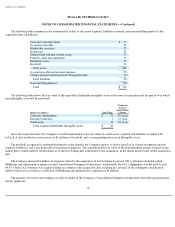
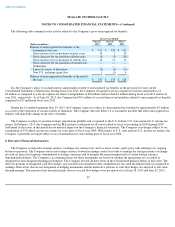
The carrying value of other intangible assets subject to amortization as of June 29, 2012 is set forth in the following table:
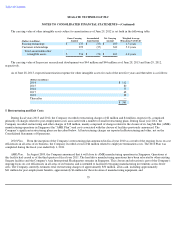
The carrying value of In-process research and development was $44 million and $44 million as of June 28, 2013 and June 29, 2012,
respectively.
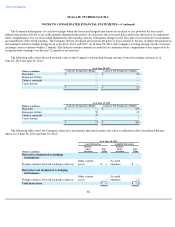
As of June 28, 2013, expected amortization expense for other intangible assets for each of the next five years and thereafter is as follows:
5. Restructuring and Exit Costs
During fiscal years 2013 and 2012, the Company recorded restructuring charges of $2 million and $4 million, respectively, comprised
primarily of charges related to post-employment costs associated with a number of small restructuring plans. During fiscal year 2011, the
Company recorded restructuring and other charges of $18 million, mainly comprised of charges related to the closure of its Ang Mo Kio (AMK)
manufacturing operations in Singapore (the "AMK Plan") and costs associated with the closure of facilities previously announced. The
Company's significant restructuring plans are described below. All restructuring charges are reported in Restructuring and other, net on the
Consolidated Statements of Operations.
2010 Plan.
From the inception of the Company's restructuring plan announced in fiscal year 2010 as a result of the ongoing focus on cost
efficiencies in all areas of its business, the Company recorded a total of $4 million related to employee termination costs. The 2010 Plan was
completed during the fiscal year ended July 1, 2011.
AMK Plan. In August 2009, the Company announced that it will close its AMK manufacturing operations in Singapore. Operations at
this facility had ceased as of the third quarter of fiscal year 2011. The hard drive manufacturing operations have been relocated to other existing
Seagate facilities and the Company's Asia International Headquarters remains in Singapore. This closure and relocation is part of the Company's
ongoing focus on cost efficiencies in all areas of its business and is intended to facilitate leveraging manufacturing investments across fewer
sites. The Company currently estimates total restructuring charges of approximately $50 million, all in cash, including approximately
$41 million for post-employment benefits, approximately $6 million for the relocation of manufacturing equipment, and
79
(Dollars in millions)
Gross Carrying
Amount
Accumulated
Amortization
Net Carrying
Amount
Weighted Average
Remaining Useful Life
Existing technology
$
137
$
(37
)
$
100
1.5 years
Customer relationships
399
(37
)
362
5.2 years
Total amortizable other
intangible assets
$
536
$
(74
)
$
462
4.4 years
(Dollars in millions)
2014
$
112
2015
80
2016
73
2017
68
2018
28
Thereafter
—
$
361