Seagate 2012 Annual Report Download - page 69
Download and view the complete annual report
Please find page 69 of the 2012 Seagate annual report below. You can navigate through the pages in the report by either clicking on the pages listed below, or by using the keyword search tool below to find specific information within the annual report.-
 1
1 -
2
-
3
-
4
-
5
-
6
-
7
-
8
-
9
-
10
-
11
-
12
-
13
-
14
-
15
-
16
-
17
-
18
-
19
-
20
-
21
-
22
-
23
-
24
-
25
-
26
-
27
-
28
-
29
-
30
-
31
-
32
-
33
-
34
-
35
-
36
-
37
-
38
-
39
-
40
-
41
-
42
-
43
-
44
-
45
-
46
-
47
-
48
-
49
-
50
-
51
-
52
-
53
-
54
-
55
-
56
-
57
-
58
-
 59
59 -
 60
60 -
 61
61 -
 62
62 -
 63
63 -
 64
64 -
 65
65 -
 66
66 -
 67
67 -
 68
68 -
 69
69 -
 70
70 -
 71
71 -
 72
72 -
 73
73 -
 74
74 -
 75
75 -
 76
76 -
 77
77 -
 78
78 -
 79
79 -
80
-
81
-
82
-
83
-
84
-
85
-
86
-
87
-
88
-
89
-
90
-
91
-
92
-
93
-
94
-
95
-
96
-
97
-
98
-
99
-
100
-
101
-
102
-
103
-
104
-
105
-
106
-
107
-
108
-
109
-
110
-
111
-
112
-
113
-
114
-
115
-
116
-
117
-
118
-
119
-
120
-
121
-
122
-
123
-
124
-
125
-
126
-
127
-
128
-
129
-
130
-
131
-
132
-
133
-
134
-
135
-
136
-
137
-
138
-
139
-
140
-
141
-
142
-
143
-
144
-
145
-
146
-
147
-
148
-
149
-
150
-
151
-
152
-
153
-
154
-
155
-
156
-
157
-
158
-
159
-
160
-
161
-
162
-
163
-
164
-
165
-
166
-
167
-
168
-
169
-
170
-
171
-
172
-
173
-
174
-
175
-
176
-
177
-
178
-
179
-
180
-
181
-
182
-
183
-
184
-
185
-
186
-
187
-
188
-
189
-
190
-
191
-
192
-
193
-
194
-
195
-
196
-
197
-
198
-
199
-
200
-
201
-
202
-
203
-
204
-
205
-
206
-
207
-
208
-
209
-
210
-
211
-
212
-
213
-
214
-
215
-
216
-
217
-
218
-
219
-
220
-
221
-
222
-
223
 |
 |

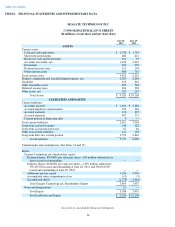
Table of Contents
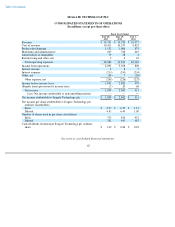
SEAGATE TECHNOLOGY PLC
CONSOLIDATED STATEMENTS OF CASH FLOWS
(In millions)
See notes to consolidated financial statements.
64
Fiscal Years Ended
June 28,
2013
June 29,
2012
July 1,
2011
OPERATING ACTIVITIES
Net income
$
1,838
$
2,862
$
511
Adjustments to reconcile net income to net cash from operating
activities:
Depreciation and amortization
873
814
754
Share
-
based compensation
76
51
51
Loss on redemption and repurchase of debt
141
17
26
Gain on sale of investments
(61
)
(12
)
—
Gain on sale of property and equipment
(36
)
(25
)
(23
)
Deferred income taxes
(70
)
(28
)
46
Other non
-
cash operating activities, net
12
7
15
Changes in operating assets and liabilities:
Accounts receivable, net
661
(824
)
(95
)
Inventories
102
99
(115
)
Accounts payable
(538
)
157
386
Accrued employee compensation
(14
)
145
(64
)
Accrued expenses, income taxes and warranty
(170
)
54
(28
)
Vendor non
-
trade receivables
272
(82
)
(168
)
Other assets and liabilities
(39
)
27
(32
)
Net cash provided by operating activities
3,047
3,262
1,264
INVESTING ACTIVITIES
Acquisition of property, equipment and leasehold improvements
(786
)
(636
)
(843
)
Proceeds from the sale of property and equipment
29
20
77
Purchases of short
-
term investments
(351
)
(454
)
(487
)
Sales of short
-
term investments
296
397
159
Maturities of short
-
term investments
38
119
101
Cash used in acquisition of LaCie S.A., net of cash acquired
(36
)
—
—
Cash used in acquisition of Samsung HDD assets and liabilities
—
(
561
)
—
Other investing activities, net
(15
)
1
12
Net cash used in investing activities
(825
)
(1,114
)
(981
)
FINANCING ACTIVITIES
Net proceeds from issuance of long
-
term debt
986
—
1,324
Repayments of long
-
term debt and capital lease obligations
(1,224
)
(670
)
(377
)
Repurchases of ordinary shares
(1,654
)
(2,426
)
(822
)
Dividends to shareholders
(518
)
(372
)
(74
)
Proceeds from issuance of ordinary shares under employee stock
plans
259
344
83
Escrow deposit for acquisition of noncontrolling shares of
LaCie S.A.
(72
)
—
—
Other financing activities, net
1
6
(3
)
Net cash (used in) provided by financing activities
(2,222
)
(3,118
)
131
Effect of foreign currency exchange rate changes on cash and
cash equivalents
1
—
—
Increase (decrease) in cash and cash equivalents
1
(970
)
414
Cash and cash equivalents at the beginning of the year
1,707
2,677
2,263
Cash and cash equivalents at the end of the year
$
1,708
$
1,707
$
2,677
Supplemental Disclosure of Cash Flow Information
Cash paid for interest
$
219
$
221
$
193
Cash paid for income taxes, net of refunds
$
48
$
8
$
18