Seagate 2012 Annual Report Download - page 63
Download and view the complete annual report
Please find page 63 of the 2012 Seagate annual report below. You can navigate through the pages in the report by either clicking on the pages listed below, or by using the keyword search tool below to find specific information within the annual report.-
 1
1 -
2
-
3
-
4
-
5
-
6
-
7
-
8
-
9
-
10
-
11
-
12
-
13
-
14
-
15
-
16
-
17
-
18
-
19
-
20
-
21
-
22
-
23
-
24
-
25
-
26
-
27
-
28
-
29
-
30
-
31
-
32
-
33
-
34
-
35
-
36
-
37
-
38
-
39
-
40
-
41
-
42
-
43
-
44
-
45
-
46
-
47
-
48
-
49
-
50
-
51
-
52
-
 53
53 -
 54
54 -
 55
55 -
 56
56 -
 57
57 -
 58
58 -
 59
59 -
 60
60 -
 61
61 -
 62
62 -
 63
63 -
 64
64 -
 65
65 -
 66
66 -
 67
67 -
 68
68 -
 69
69 -
 70
70 -
 71
71 -
 72
72 -
 73
73 -
74
-
75
-
76
-
77
-
78
-
79
-
80
-
81
-
82
-
83
-
84
-
85
-
86
-
87
-
88
-
89
-
90
-
91
-
92
-
93
-
94
-
95
-
96
-
97
-
98
-
99
-
100
-
101
-
102
-
103
-
104
-
105
-
106
-
107
-
108
-
109
-
110
-
111
-
112
-
113
-
114
-
115
-
116
-
117
-
118
-
119
-
120
-
121
-
122
-
123
-
124
-
125
-
126
-
127
-
128
-
129
-
130
-
131
-
132
-
133
-
134
-
135
-
136
-
137
-
138
-
139
-
140
-
141
-
142
-
143
-
144
-
145
-
146
-
147
-
148
-
149
-
150
-
151
-
152
-
153
-
154
-
155
-
156
-
157
-
158
-
159
-
160
-
161
-
162
-
163
-
164
-
165
-
166
-
167
-
168
-
169
-
170
-
171
-
172
-
173
-
174
-
175
-
176
-
177
-
178
-
179
-
180
-
181
-
182
-
183
-
184
-
185
-
186
-
187
-
188
-
189
-
190
-
191
-
192
-
193
-
194
-
195
-
196
-
197
-
198
-
199
-
200
-
201
-
202
-
203
-
204
-
205
-
206
-
207
-
208
-
209
-
210
-
211
-
212
-
213
-
214
-
215
-
216
-
217
-
218
-
219
-
220
-
221
-
222
-
223
 |
 |

Table of Contents
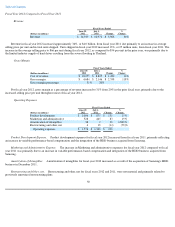
The table below presents principal amounts and related weighted average interest rates by year of maturity for our investment portfolio and
debt obligations as of June 28, 2013. All short-term investments mature in four years or less.
Fiscal Years Ended
Foreign Currency Exchange Risk. We may enter into foreign currency forward exchange contracts to manage exposure related to certain
foreign currency commitments and anticipated foreign currency denominated expenditures. Our policy prohibits us from entering into derivative
financial instruments for speculative or trading purposes. During fiscal years 2013 and 2012, we did not enter into any hedges of net investments
in foreign operations.
We also hedge a portion of our foreign currency denominated balance sheet positions with foreign currency forward exchange contracts to
reduce the risk that our earnings will be adversely affected by changes in currency exchange rates. The changes in fair value of these hedges are
recognized in earnings in the same period as the gains and losses from the remeasurement of the assets and liabilities. These foreign currency
forward exchange contracts are not designated as hedging instruments under ASC 815, Derivatives and Hedging. All these forward contracts
mature within 12 months.
We evaluate hedging effectiveness prospectively and retrospectively and record any ineffective portion of the hedging instruments in Costs
of Revenue on the Consolidated Statements of Operations. We did not have any material net gains (losses) recognized in Costs of Revenue for
cash flow hedges due to hedge ineffectiveness or discontinued cash flow hedges during fiscal years 2013 and 2012.
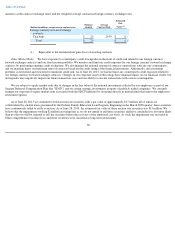
The table below provides information as of June 28, 2013 about our foreign currency forward exchange contracts. The table is provided in
U.S. dollar equivalent amounts and presents the notional
59
(Dollars in millions,
except percentages)
2014
2015
2016
2017
2018
Thereafter
Total
Fair Value
at
June 28, 2013
Assets
Cash
equivalents:
Fixed rate
$
1,528
$
—
$
—
$
—
$
—
$
—
$
1,528
$
1,528
Average
interest
rate
0.07
%
0.07
%
Short-term
investments:
Fixed rate
$
105
$
150
$
161
$
40
$
13
$
—
$
469
$
478
Average
interest
rate
0.62
%
0.75
%
0.97
%
2.01
%
2.47
%
0.95
%
Long-term
investments:
Variable rate
$
—
$
—
$
—
$
—
$
—
$
17
$
17
$
15
Average
interest
rate
0.68
%
0.68
%
Total fixed
income
$
1,633
$
150
$
161
$
40
$
13
$
17
$
2,014
$
2,021
Average
interest
rate
0.11
%
0.75
%
0.97
%
2.01
%
2.47
%
0.68
%
0.28
%
Debt
Fixed rate
$
3
$
2
$
—
$
335
$
—
$
2,437
$
2,777
2,860
Average
interest
rate
0.89
%
0.90
%
6.80
%
6.12
%
6.17
%