Seagate 2012 Annual Report Download - page 56
Download and view the complete annual report
Please find page 56 of the 2012 Seagate annual report below. You can navigate through the pages in the report by either clicking on the pages listed below, or by using the keyword search tool below to find specific information within the annual report.-
 1
1 -
2
-
3
-
4
-
5
-
6
-
7
-
8
-
9
-
10
-
11
-
12
-
13
-
14
-
15
-
16
-
17
-
18
-
19
-
20
-
21
-
22
-
23
-
24
-
25
-
26
-
27
-
28
-
29
-
30
-
31
-
32
-
33
-
34
-
35
-
36
-
37
-
38
-
39
-
40
-
41
-
42
-
43
-
44
-
45
-
 46
46 -
 47
47 -
 48
48 -
 49
49 -
 50
50 -
 51
51 -
 52
52 -
 53
53 -
 54
54 -
 55
55 -
 56
56 -
 57
57 -
 58
58 -
 59
59 -
 60
60 -
 61
61 -
 62
62 -
 63
63 -
 64
64 -
 65
65 -
 66
66 -
67
-
68
-
69
-
70
-
71
-
72
-
73
-
74
-
75
-
76
-
77
-
78
-
79
-
80
-
81
-
82
-
83
-
84
-
85
-
86
-
87
-
88
-
89
-
90
-
91
-
92
-
93
-
94
-
95
-
96
-
97
-
98
-
99
-
100
-
101
-
102
-
103
-
104
-
105
-
106
-
107
-
108
-
109
-
110
-
111
-
112
-
113
-
114
-
115
-
116
-
117
-
118
-
119
-
120
-
121
-
122
-
123
-
124
-
125
-
126
-
127
-
128
-
129
-
130
-
131
-
132
-
133
-
134
-
135
-
136
-
137
-
138
-
139
-
140
-
141
-
142
-
143
-
144
-
145
-
146
-
147
-
148
-
149
-
150
-
151
-
152
-
153
-
154
-
155
-
156
-
157
-
158
-
159
-
160
-
161
-
162
-
163
-
164
-
165
-
166
-
167
-
168
-
169
-
170
-
171
-
172
-
173
-
174
-
175
-
176
-
177
-
178
-
179
-
180
-
181
-
182
-
183
-
184
-
185
-
186
-
187
-
188
-
189
-
190
-
191
-
192
-
193
-
194
-
195
-
196
-
197
-
198
-
199
-
200
-
201
-
202
-
203
-
204
-
205
-
206
-
207
-
208
-
209
-
210
-
211
-
212
-
213
-
214
-
215
-
216
-
217
-
218
-
219
-
220
-
221
-
222
-
223
 |
 |

Table of Contents
value of our cash equivalents or short-term investments and accordingly, we do not believe the fair value of our short-term investments has
significantly changed from the values reported as of June 28, 2013.
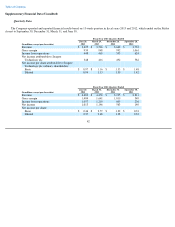
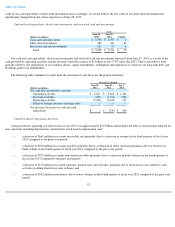
Cash and cash equivalents, short-term investments, and restricted cash and investments
Our cash and cash equivalents, short-term investments and restricted cash and investments increased from June 29, 2012 as a result of net
cash provided by operating activities and the proceeds from the issuance of $1 billion of our 4.75% notes due 2023. These cash inflows were
partially offset by our repurchases of our ordinary shares, capital expenditures, redemption and repurchase of certain of our long-term debt, and
dividends paid to our shareholders.
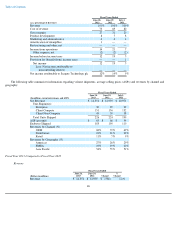
The following table summarizes results from the statement of cash flows for the periods indicated:
Cash Provided by Operating Activities
Cash provided by operating activities for fiscal year 2013 was approximately $3.0 billion and includes the effects of net income adjusted for
non-cash items including depreciation, amortization, stock-based compensation, and:
• a decrease of $661 million in accounts receivable, net, primarily due to a decrease in revenue in the fourth quarter of fiscal year
2013 compared to the prior year period;
• a decrease of $538 million in accounts payable, primarily due to a reduction in direct materials purchases due to a decrease in
build volume in the fourth quarter of fiscal year 2013 compared to the prior year period;
• a decrease of $272 million in vendor non-trade receivables primarily due to a decrease in build volumes in the fourth quarter of
fiscal year 2013 compared to the prior year period;
• a decrease of $170 million in accrued expenses, income taxes and warranty, primarily due to decreases in costs related to sales
activities resulting from lower sales volumes; and
• a decrease of $102 million in inventory, due to lower volumes in the fourth quarter of fiscal year 2013 compared to the prior year
period.
52
As of
(Dollars in millions)
June 28,
2013
June 29,
2012
Change
Cash and cash equivalents
$
1,708
$
1,707
$
1
Short
-
term investments
480
411
69
Restricted cash and investments
101
93
8
Total
$
2,289
$
2,211
$
78
Fiscal Years Ended
(Dollars in millions)
June 28,
2013
June 29,
2012
July 1,
2011
Net cash flow provided by (used in):
Operating activities
$
3,047
$
3,262
$
1,264
Investing activities
(825
)
(1,114
)
(981
)
Financing activities
(2,222
)
(3,118
)
131
Effect of foreign currency exchange rates
1
—
—
Net increase (decrease) in cash and cash
equivalents
$
1
$
(970
)
$
414