Seagate 2012 Annual Report Download - page 106
Download and view the complete annual report
Please find page 106 of the 2012 Seagate annual report below. You can navigate through the pages in the report by either clicking on the pages listed below, or by using the keyword search tool below to find specific information within the annual report.-
 1
1 -
2
-
3
-
4
-
5
-
6
-
7
-
8
-
9
-
10
-
11
-
12
-
13
-
14
-
15
-
16
-
17
-
18
-
19
-
20
-
21
-
22
-
23
-
24
-
25
-
26
-
27
-
28
-
29
-
30
-
31
-
32
-
33
-
34
-
35
-
36
-
37
-
38
-
39
-
40
-
41
-
42
-
43
-
44
-
45
-
46
-
47
-
48
-
49
-
50
-
51
-
52
-
53
-
54
-
55
-
56
-
57
-
58
-
59
-
60
-
61
-
62
-
63
-
64
-
65
-
66
-
67
-
68
-
69
-
70
-
71
-
72
-
73
-
74
-
75
-
76
-
77
-
78
-
79
-
80
-
81
-
82
-
83
-
84
-
85
-
86
-
87
-
88
-
89
-
90
-
91
-
92
-
93
-
94
-
95
-
 96
96 -
 97
97 -
 98
98 -
 99
99 -
 100
100 -
 101
101 -
 102
102 -
 103
103 -
 104
104 -
 105
105 -
 106
106 -
 107
107 -
 108
108 -
 109
109 -
 110
110 -
 111
111 -
 112
112 -
 113
113 -
 114
114 -
 115
115 -
 116
116 -
117
-
118
-
119
-
120
-
121
-
122
-
123
-
124
-
125
-
126
-
127
-
128
-
129
-
130
-
131
-
132
-
133
-
134
-
135
-
136
-
137
-
138
-
139
-
140
-
141
-
142
-
143
-
144
-
145
-
146
-
147
-
148
-
149
-
150
-
151
-
152
-
153
-
154
-
155
-
156
-
157
-
158
-
159
-
160
-
161
-
162
-
163
-
164
-
165
-
166
-
167
-
168
-
169
-
170
-
171
-
172
-
173
-
174
-
175
-
176
-
177
-
178
-
179
-
180
-
181
-
182
-
183
-
184
-
185
-
186
-
187
-
188
-
189
-
190
-
191
-
192
-
193
-
194
-
195
-
196
-
197
-
198
-
199
-
200
-
201
-
202
-
203
-
204
-
205
-
206
-
207
-
208
-
209
-
210
-
211
-
212
-
213
-
214
-
215
-
216
-
217
-
218
-
219
-
220
-
221
-
222
-
223
 |
 |

Table of Contents
SEAGATE TECHNOLOGY PLC
NOTES TO CONSOLIDATED FINANCIAL STATEMENTS—(Continued)
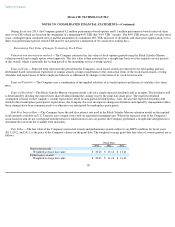
During fiscal year 2013, the Company granted 0.2 million performance-based options and 0.1 million performance-based restricted share
units to its CEO which are based on the attainment of a minimum 40% TSR (the "40% TSR" awards). The 40% TSR awards cliff vest after three
years, contingent upon continued service and the attainment of a minimum 40% TSR, inclusive of dividends and share price appreciation, over a
three-year performance period, which TSR must be sustained for a minimum of 30 consecutive trading days.
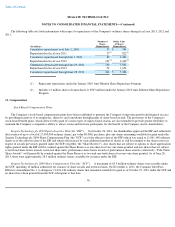
Determining Fair Value of Seagate Technology Stock Plans
Valuation and amortization method —The Company estimates the fair value of stock options granted using the Black-Scholes-Merton
valuation model and a single option award approach. This fair value is then amortized on a straight-line basis over the requisite service periods
of the awards, which is generally the vesting period or the remaining service (vesting) period.
Expected Term —Expected term represents the period that the Company's stock-based awards are expected to be outstanding and was
determined based on historical experience of similar awards, giving consideration to the contractual terms of the stock-based awards, vesting
schedules and expectations of future employee behavior as influenced by changes to the terms of its stock-based awards.
Expected Volatility —The Company uses a combination of the implied volatility of its traded options and historical volatility of its share
price.
Expected Dividend —The Black-Scholes-Merton valuation model calls for a single expected dividend yield as an input. The dividend yield
is determined by dividing the expected per share dividend during the coming year by the grant date share price. The expected dividend
assumption is based on the Company's current expectations about its anticipated dividend policy. Also, because the expected dividend yield
should reflect marketplace participants' expectations, the Company does not incorporate changes in dividends anticipated by management unless
those changes have been communicated to or otherwise are anticipated by marketplace participants.
Risk-Free Interest Rate —The Company bases the risk-free interest rate used in the Black-Scholes-Merton valuation model on the implied
yield currently available on U.S. Treasury zero
-coupon issues with an equivalent remaining term. Where the expected term of the Company's
stock-based awards do not correspond with the terms for which interest rates are quoted, the Company performed a straight-line interpolation to
determine the rate from the available term maturities.
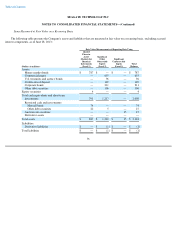
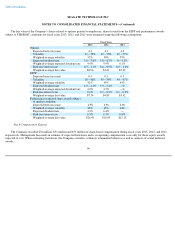
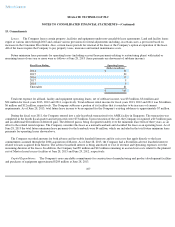
Fair Value —The fair value of the Company's nonvested awards and performance awards subject to an AEPS condition for fiscal years
2013, 2012, and 2011, is the price of the Company's shares on the grant date. The weighted average grant date fair value of awards granted are as
follows:
98
Fiscal Years
2013
2012
2011
Nonvested awards:
Weighted
-
average fair value
$
30.26
$
13.14
$
11.61
Performance awards:
Weighted
-
average fair value
$
30.01
$
11.16
$
13.63