Seagate 2012 Annual Report Download - page 78
Download and view the complete annual report
Please find page 78 of the 2012 Seagate annual report below. You can navigate through the pages in the report by either clicking on the pages listed below, or by using the keyword search tool below to find specific information within the annual report.-
 1
1 -
2
-
3
-
4
-
5
-
6
-
7
-
8
-
9
-
10
-
11
-
12
-
13
-
14
-
15
-
16
-
17
-
18
-
19
-
20
-
21
-
22
-
23
-
24
-
25
-
26
-
27
-
28
-
29
-
30
-
31
-
32
-
33
-
34
-
35
-
36
-
37
-
38
-
39
-
40
-
41
-
42
-
43
-
44
-
45
-
46
-
47
-
48
-
49
-
50
-
51
-
52
-
53
-
54
-
55
-
56
-
57
-
58
-
59
-
60
-
61
-
62
-
63
-
64
-
65
-
66
-
67
-
 68
68 -
 69
69 -
 70
70 -
 71
71 -
 72
72 -
 73
73 -
 74
74 -
 75
75 -
 76
76 -
 77
77 -
 78
78 -
 79
79 -
 80
80 -
 81
81 -
 82
82 -
 83
83 -
 84
84 -
 85
85 -
 86
86 -
 87
87 -
 88
88 -
89
-
90
-
91
-
92
-
93
-
94
-
95
-
96
-
97
-
98
-
99
-
100
-
101
-
102
-
103
-
104
-
105
-
106
-
107
-
108
-
109
-
110
-
111
-
112
-
113
-
114
-
115
-
116
-
117
-
118
-
119
-
120
-
121
-
122
-
123
-
124
-
125
-
126
-
127
-
128
-
129
-
130
-
131
-
132
-
133
-
134
-
135
-
136
-
137
-
138
-
139
-
140
-
141
-
142
-
143
-
144
-
145
-
146
-
147
-
148
-
149
-
150
-
151
-
152
-
153
-
154
-
155
-
156
-
157
-
158
-
159
-
160
-
161
-
162
-
163
-
164
-
165
-
166
-
167
-
168
-
169
-
170
-
171
-
172
-
173
-
174
-
175
-
176
-
177
-
178
-
179
-
180
-
181
-
182
-
183
-
184
-
185
-
186
-
187
-
188
-
189
-
190
-
191
-
192
-
193
-
194
-
195
-
196
-
197
-
198
-
199
-
200
-
201
-
202
-
203
-
204
-
205
-
206
-
207
-
208
-
209
-
210
-
211
-
212
-
213
-
214
-
215
-
216
-
217
-
218
-
219
-
220
-
221
-
222
-
223
 |
 |

Table of Contents
SEAGATE TECHNOLOGY PLC
NOTES TO CONSOLIDATED FINANCIAL STATEMENTS—(Continued)
2. Balance Sheet Information
Investments
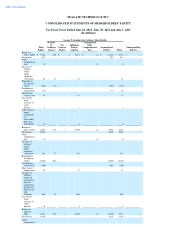
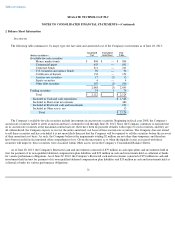
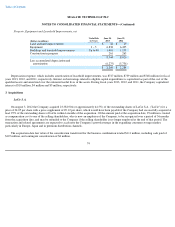
The following table summarizes, by major type, the fair value and amortized cost of the Company's investments as of June 28, 2013:
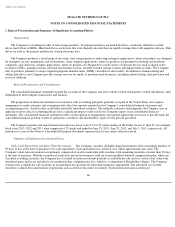
The Company's available-for-sale securities include investments in auction rate securities. Beginning in fiscal year 2008, the Company's
auction rate securities failed to settle at auction and have continued to fail through June 28, 2013. Since the Company continues to earn interest
on its auction rate securities at the maximum contractual rate, there have been no payment defaults with respect to such securities, and they are
all collateralized, the Company expects to recover the entire amortized cost basis of these auction rate securities. The Company does not intend
to sell these securities and has concluded it is not more likely than not that the Company will be required to sell the securities before the recovery
of their amortized cost basis. As such, the Company believes the impairments totaling $2 million are not other-than-temporary and therefore
have been recorded in Accumulated other comprehensive loss. Given the uncertainty as to when the liquidity issues associated with these
securities will improve, these securities were classified within Other assets, net in the Company's Consolidated Balance Sheets.
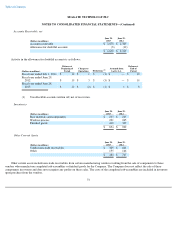
As of June 28, 2013, the Company's Restricted cash and investments consisted of $79 million in cash equivalents and investments held in
trust for payment of its non-qualified deferred compensation plan liabilities and $22 million in cash and investments held as collateral at banks
for various performance obligations. As of June 29, 2012, the Company's Restricted cash and investments consisted of $73 million in cash and
investments held in trust for payment of its non-qualified deferred compensation plan liabilities and $20 million in cash and investments held as
collateral at banks for various performance obligations.
71
(Dollars in millions)
Amortized
Cost
Unrealized
Gain/(Loss)
Fair
Value
Available
-
for
-
sale securities:
Money market funds
$
804
$
—
$
804
Commercial paper
655
—
655
Corporate bonds
211
—
211
U.S. treasuries and agency bonds
96
—
96
Certificates of deposit
154
—
154
Auction rate securities
17
(2
)
15
Equity securities
4
—
4
Other debt securities
107
(1
)
106
2,048
(3
)
2,045
Trading securities
74
5
79
Total
$
2,122
$
2
$
2,124
Included in Cash and cash equivalents
$
1,528
Included in Short
-
term investments
480
Included in Restricted cash and investments
101
Included in Other assets, net
15
Total
$
2,124