Seagate 2012 Annual Report Download - page 57
Download and view the complete annual report
Please find page 57 of the 2012 Seagate annual report below. You can navigate through the pages in the report by either clicking on the pages listed below, or by using the keyword search tool below to find specific information within the annual report.-
 1
1 -
2
-
3
-
4
-
5
-
6
-
7
-
8
-
9
-
10
-
11
-
12
-
13
-
14
-
15
-
16
-
17
-
18
-
19
-
20
-
21
-
22
-
23
-
24
-
25
-
26
-
27
-
28
-
29
-
30
-
31
-
32
-
33
-
34
-
35
-
36
-
37
-
38
-
39
-
40
-
41
-
42
-
43
-
44
-
45
-
46
-
 47
47 -
 48
48 -
 49
49 -
 50
50 -
 51
51 -
 52
52 -
 53
53 -
 54
54 -
 55
55 -
 56
56 -
 57
57 -
 58
58 -
 59
59 -
 60
60 -
 61
61 -
 62
62 -
 63
63 -
 64
64 -
 65
65 -
 66
66 -
 67
67 -
68
-
69
-
70
-
71
-
72
-
73
-
74
-
75
-
76
-
77
-
78
-
79
-
80
-
81
-
82
-
83
-
84
-
85
-
86
-
87
-
88
-
89
-
90
-
91
-
92
-
93
-
94
-
95
-
96
-
97
-
98
-
99
-
100
-
101
-
102
-
103
-
104
-
105
-
106
-
107
-
108
-
109
-
110
-
111
-
112
-
113
-
114
-
115
-
116
-
117
-
118
-
119
-
120
-
121
-
122
-
123
-
124
-
125
-
126
-
127
-
128
-
129
-
130
-
131
-
132
-
133
-
134
-
135
-
136
-
137
-
138
-
139
-
140
-
141
-
142
-
143
-
144
-
145
-
146
-
147
-
148
-
149
-
150
-
151
-
152
-
153
-
154
-
155
-
156
-
157
-
158
-
159
-
160
-
161
-
162
-
163
-
164
-
165
-
166
-
167
-
168
-
169
-
170
-
171
-
172
-
173
-
174
-
175
-
176
-
177
-
178
-
179
-
180
-
181
-
182
-
183
-
184
-
185
-
186
-
187
-
188
-
189
-
190
-
191
-
192
-
193
-
194
-
195
-
196
-
197
-
198
-
199
-
200
-
201
-
202
-
203
-
204
-
205
-
206
-
207
-
208
-
209
-
210
-
211
-
212
-
213
-
214
-
215
-
216
-
217
-
218
-
219
-
220
-
221
-
222
-
223
 |
 |

Table of Contents
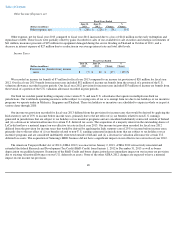
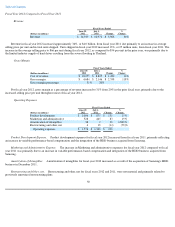
Cash provided by operating activities for fiscal year 2012 was approximately $3.3 billion and includes the effects of net income adjusted for
non-cash items including depreciation, amortization, stock-based compensation, and:
• an increase of $824 million in accounts receivable, net, due to an increase in revenues;
• an increase of $157 million in accounts payable due to higher direct material purchases related to an increase in volume, partially
offset by a change in supplier payment terms; and
• an increase of $145 million in accrued employee compensation reflecting an increase in variable performance-based
compensation.
Cash provided by operating activities for fiscal year 2011 was approximately $1.3 billion and includes the effects of net income adjusted for
non-cash items including depreciation, amortization, stock-based compensation, impairment of long-lived assets, and:
• an increase of $386 million in accounts payable due to higher direct material purchases related to an increase in volume;
• an increase of $168 million related to an increase in vendor non-trade receivables; and
• an increase of $115 million in inventories related to an increase in volume.
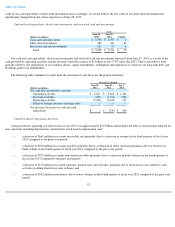
Cash Used in Investing Activities
In fiscal year 2013, we used $0.8 billion for net cash investing activities, which was primarily due to payments for property, equipment and
leasehold improvements.
In fiscal year 2012, we used $1.1 billion for net cash investing activities, which was primarily due to payments for property, equipment and
leasehold improvements of approximately $0.6 billion and net payments for the acquisition of Samsung's HDD business of $0.6 billion.
In fiscal year 2011, we used $1.0 billion for net cash investing activities, which was primarily attributable to payments for property,
equipment and leasehold improvements of approximately $0.8 billion.
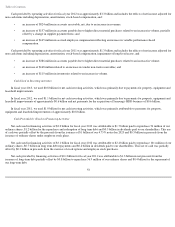
Cash Provided by (Used in) Financing Activities
Net cash used in financing activities of $2.2 billion for fiscal year 2013 was attributable to $1.7 billion paid to repurchase 54 million of our
ordinary shares, $1.2 billion for the repurchase and redemption of long term debt and $0.5 billion in dividends paid to our shareholders. This use
of cash was partially offset by the proceeds from the issuance of $1 billion of our 4.75% notes due 2023 and $0.3 billion in proceeds from the
issuance of ordinary shares under employee stock plans.
Net cash used in financing activities of $3.1 billion for fiscal year 2012 was attributable to $2.4 billion paid to repurchase 101 million of our
ordinary shares, $0.7 billion in long term debt repayments and $0.4 billion in dividends paid to our shareholders. This use of cash was partially
offset by $0.3 billion in proceeds from the exercise of stock options and employee stock purchases.
Net cash provided by financing activities of $0.1 billion for fiscal year 2011 was attributable to $1.3 billion in net proceeds from the
issuance of long-term debt partially offset by $0.8 billion to repurchase 56.9 million of our ordinary shares and $0.4 billion for the repayment of
our long-term debt.
53