Seagate 2012 Annual Report Download - page 100
Download and view the complete annual report
Please find page 100 of the 2012 Seagate annual report below. You can navigate through the pages in the report by either clicking on the pages listed below, or by using the keyword search tool below to find specific information within the annual report.-
 1
1 -
2
-
3
-
4
-
5
-
6
-
7
-
8
-
9
-
10
-
11
-
12
-
13
-
14
-
15
-
16
-
17
-
18
-
19
-
20
-
21
-
22
-
23
-
24
-
25
-
26
-
27
-
28
-
29
-
30
-
31
-
32
-
33
-
34
-
35
-
36
-
37
-
38
-
39
-
40
-
41
-
42
-
43
-
44
-
45
-
46
-
47
-
48
-
49
-
50
-
51
-
52
-
53
-
54
-
55
-
56
-
57
-
58
-
59
-
60
-
61
-
62
-
63
-
64
-
65
-
66
-
67
-
68
-
69
-
70
-
71
-
72
-
73
-
74
-
75
-
76
-
77
-
78
-
79
-
80
-
81
-
82
-
83
-
84
-
85
-
86
-
87
-
88
-
89
-
 90
90 -
 91
91 -
 92
92 -
 93
93 -
 94
94 -
 95
95 -
 96
96 -
 97
97 -
 98
98 -
 99
99 -
 100
100 -
 101
101 -
 102
102 -
 103
103 -
 104
104 -
 105
105 -
 106
106 -
 107
107 -
 108
108 -
 109
109 -
 110
110 -
111
-
112
-
113
-
114
-
115
-
116
-
117
-
118
-
119
-
120
-
121
-
122
-
123
-
124
-
125
-
126
-
127
-
128
-
129
-
130
-
131
-
132
-
133
-
134
-
135
-
136
-
137
-
138
-
139
-
140
-
141
-
142
-
143
-
144
-
145
-
146
-
147
-
148
-
149
-
150
-
151
-
152
-
153
-
154
-
155
-
156
-
157
-
158
-
159
-
160
-
161
-
162
-
163
-
164
-
165
-
166
-
167
-
168
-
169
-
170
-
171
-
172
-
173
-
174
-
175
-
176
-
177
-
178
-
179
-
180
-
181
-
182
-
183
-
184
-
185
-
186
-
187
-
188
-
189
-
190
-
191
-
192
-
193
-
194
-
195
-
196
-
197
-
198
-
199
-
200
-
201
-
202
-
203
-
204
-
205
-
206
-
207
-
208
-
209
-
210
-
211
-
212
-
213
-
214
-
215
-
216
-
217
-
218
-
219
-
220
-
221
-
222
-
223
 |
 |

Table of Contents
SEAGATE TECHNOLOGY PLC
NOTES TO CONSOLIDATED FINANCIAL STATEMENTS—(Continued)
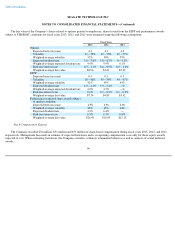
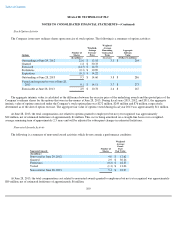
The following table presents the Company's assets and liabilities that are measured at fair value on a recurring basis, excluding accrued
interest components, as of June 29, 2012:
92
Fair Value Measurements at Reporting Date Using
(Dollars in millions)
Quoted
Prices in
Active
Markets for
Identical
Instruments
(Level 1)
Significant
Other
Observable
Inputs
(Level 2)
Significant
Unobservable
Inputs
(Level 3)
Total
Balance
Assets:
Cash and cash equivalents
$
787
$
741
$
—
$
1,528
Short
-
term investments
4
476
—
480
Restricted cash and investments
96
5
—
101
Other current assets
—
—
—
—
Other assets, net
—
—
15
15
Total assets
$
887
$
1,222
$
15
$
2,124
Liabilities:
Accrued expenses
$
—
$
(
1
)
$
—
$
(
1
)
Total liabilities
$
—
$
(
1
)
$
—
$
(
1
)
Fair Value Measurements at Reporting Date Using
(Dollars in millions)
Quoted
Prices in
Active
Markets for
Identical
Instruments
(Level 1)
Significant
Other
Observable
Inputs
(Level 2)
Significant
Unobservable
Inputs
(Level 3)
Total
Balance
Assets:
Money market funds
$
1,140
$
—
$
—
$
1,140
Commercial paper
—
393
—
393
U.S. treasuries and agency bonds
—
99
—
99
Certificates of deposit
—
4
—
4
Corporate bonds
—
209
—
209
Other debt securities
—
99
—
99
Total cash equivalents and short-term
investments
1,140
804
—
1,944
Restricted Cash and Investments:
Mutual Funds
66
—
—
66
Other debt securities
25
2
—
27
Auction rate securities
—
—
15
15
Derivative assets
—
2
—
2
Total Assets
$
1,231
$
808
$
15
$
2,054
Liabilities:
Derivative liabilities
$
—
$
(
2
)
$
—
$
(
2
)
Total Liabilities
$
—
$
(
2
)
$
—
$
(
2
)