Seagate 2012 Annual Report Download - page 49
Download and view the complete annual report
Please find page 49 of the 2012 Seagate annual report below. You can navigate through the pages in the report by either clicking on the pages listed below, or by using the keyword search tool below to find specific information within the annual report.-
 1
1 -
2
-
3
-
4
-
5
-
6
-
7
-
8
-
9
-
10
-
11
-
12
-
13
-
14
-
15
-
16
-
17
-
18
-
19
-
20
-
21
-
22
-
23
-
24
-
25
-
26
-
27
-
28
-
29
-
30
-
31
-
32
-
33
-
34
-
35
-
36
-
37
-
38
-
 39
39 -
 40
40 -
 41
41 -
 42
42 -
 43
43 -
 44
44 -
 45
45 -
 46
46 -
 47
47 -
 48
48 -
 49
49 -
 50
50 -
 51
51 -
 52
52 -
 53
53 -
 54
54 -
 55
55 -
 56
56 -
 57
57 -
 58
58 -
 59
59 -
60
-
61
-
62
-
63
-
64
-
65
-
66
-
67
-
68
-
69
-
70
-
71
-
72
-
73
-
74
-
75
-
76
-
77
-
78
-
79
-
80
-
81
-
82
-
83
-
84
-
85
-
86
-
87
-
88
-
89
-
90
-
91
-
92
-
93
-
94
-
95
-
96
-
97
-
98
-
99
-
100
-
101
-
102
-
103
-
104
-
105
-
106
-
107
-
108
-
109
-
110
-
111
-
112
-
113
-
114
-
115
-
116
-
117
-
118
-
119
-
120
-
121
-
122
-
123
-
124
-
125
-
126
-
127
-
128
-
129
-
130
-
131
-
132
-
133
-
134
-
135
-
136
-
137
-
138
-
139
-
140
-
141
-
142
-
143
-
144
-
145
-
146
-
147
-
148
-
149
-
150
-
151
-
152
-
153
-
154
-
155
-
156
-
157
-
158
-
159
-
160
-
161
-
162
-
163
-
164
-
165
-
166
-
167
-
168
-
169
-
170
-
171
-
172
-
173
-
174
-
175
-
176
-
177
-
178
-
179
-
180
-
181
-
182
-
183
-
184
-
185
-
186
-
187
-
188
-
189
-
190
-
191
-
192
-
193
-
194
-
195
-
196
-
197
-
198
-
199
-
200
-
201
-
202
-
203
-
204
-
205
-
206
-
207
-
208
-
209
-
210
-
211
-
212
-
213
-
214
-
215
-
216
-
217
-
218
-
219
-
220
-
221
-
222
-
223
 |
 |

Table of Contents
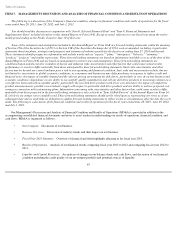
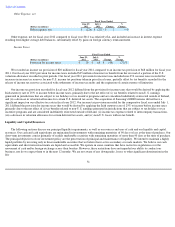
We believe that in the foreseeable future the traditional enterprise and client compute markets that require high capacity storage solutions,
as well as the data intensive client non-compute markets, will continue to be best served by hard disk drives due to the industry's ability to
deliver cost effective, reliable and energy efficient mass storage devices. Furthermore, the increased use of client non-compute devices that
consume media rich content streamed from the cloud increases the demand for high capacity disk drives in nearline applications.
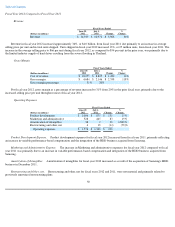
Price Erosion. Historically, our industry has been characterized by price declines for disk drive products with comparable capacity,
performance and feature sets ("like-for-like products").
Disk drive manufacturers typically attempt to offset price erosion with an improved mix of disk drive products characterized by higher
capacity, better performance and additional feature sets and/or product cost reductions.
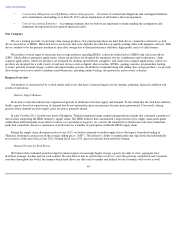
Seasonality
The disk drive industry traditionally experiences seasonal variability in demand with higher levels of demand in the second half of the
calendar year. This seasonality is driven by consumer spending in the back-to-school season from late summer to fall and the traditional holiday
shopping season from fall to winter. In addition, corporate demand is typically higher during the second half of the calendar year.
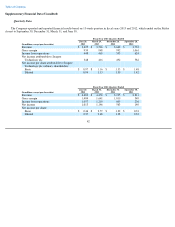
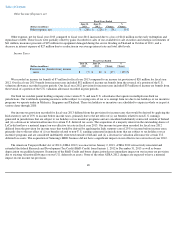
Fiscal Year 2013 Summary
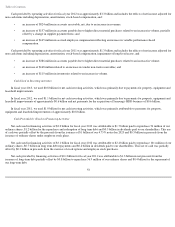
Revenues for fiscal year 2013 were $14.4 billion while gross margin as a percentage of revenue was 27%. We repurchased 54 million of our
ordinary shares during the year for approximately $1.7 billion, paid dividends of $0.5 billion, paid $1.2 billion for the early redemption and
repurchase of debt with a principal value of $1.1 billion and issued $1.0 billion of 4.75% Senior Notes due 2023.
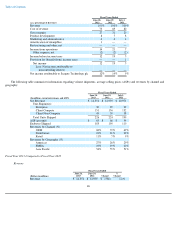
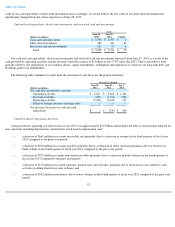
Results of Operations
We list in the table below summarized information from our consolidated statements of operations by dollars and as a percentage of
revenue:
45
Fiscal Years Ended
(Dollars in millions)
June 28,
2013
June 29,
2012
July 1,
2011
Revenue
$
14,351
$
14,939
$
10,971
Cost of revenue
10,411
10,255
8,825
Gross margin
3,940
4,684
2,146
Product development
1,133
1,006
875
Marketing and administrative
635
528
445
Amortization of intangibles
79
38
2
Restructuring and other, net
2
4
18
Income from operations
2,091
3,108
806
Other expense, net
(260
)
(226
)
(227
)
Income before income taxes
1,831
2,882
579
(Benefit from) provision for income taxes
(7
)
20
68
Net income
1,838
2,862
511
Less: Net income attributable to
noncontrolling interest
—
—
—
Net income attributable to Seagate
Technology plc
$
1,838
$
2,862
$
511