Seagate 2012 Annual Report Download - page 54
Download and view the complete annual report
Please find page 54 of the 2012 Seagate annual report below. You can navigate through the pages in the report by either clicking on the pages listed below, or by using the keyword search tool below to find specific information within the annual report.-
 1
1 -
2
-
3
-
4
-
5
-
6
-
7
-
8
-
9
-
10
-
11
-
12
-
13
-
14
-
15
-
16
-
17
-
18
-
19
-
20
-
21
-
22
-
23
-
24
-
25
-
26
-
27
-
28
-
29
-
30
-
31
-
32
-
33
-
34
-
35
-
36
-
37
-
38
-
39
-
40
-
41
-
42
-
43
-
 44
44 -
 45
45 -
 46
46 -
 47
47 -
 48
48 -
 49
49 -
 50
50 -
 51
51 -
 52
52 -
 53
53 -
 54
54 -
 55
55 -
 56
56 -
 57
57 -
 58
58 -
 59
59 -
 60
60 -
 61
61 -
 62
62 -
 63
63 -
 64
64 -
65
-
66
-
67
-
68
-
69
-
70
-
71
-
72
-
73
-
74
-
75
-
76
-
77
-
78
-
79
-
80
-
81
-
82
-
83
-
84
-
85
-
86
-
87
-
88
-
89
-
90
-
91
-
92
-
93
-
94
-
95
-
96
-
97
-
98
-
99
-
100
-
101
-
102
-
103
-
104
-
105
-
106
-
107
-
108
-
109
-
110
-
111
-
112
-
113
-
114
-
115
-
116
-
117
-
118
-
119
-
120
-
121
-
122
-
123
-
124
-
125
-
126
-
127
-
128
-
129
-
130
-
131
-
132
-
133
-
134
-
135
-
136
-
137
-
138
-
139
-
140
-
141
-
142
-
143
-
144
-
145
-
146
-
147
-
148
-
149
-
150
-
151
-
152
-
153
-
154
-
155
-
156
-
157
-
158
-
159
-
160
-
161
-
162
-
163
-
164
-
165
-
166
-
167
-
168
-
169
-
170
-
171
-
172
-
173
-
174
-
175
-
176
-
177
-
178
-
179
-
180
-
181
-
182
-
183
-
184
-
185
-
186
-
187
-
188
-
189
-
190
-
191
-
192
-
193
-
194
-
195
-
196
-
197
-
198
-
199
-
200
-
201
-
202
-
203
-
204
-
205
-
206
-
207
-
208
-
209
-
210
-
211
-
212
-
213
-
214
-
215
-
216
-
217
-
218
-
219
-
220
-
221
-
222
-
223
 |
 |

Table of Contents
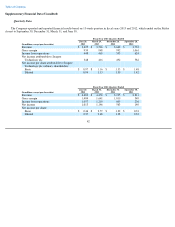
Fiscal Year 2012 Compared to Fiscal Year 2011
Revenue
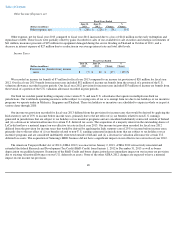
Revenue in fiscal year 2012 increased approximately 36%, or $4.0 billion, from fiscal year 2011 due primarily to an increase in average
selling price per unit and in total units shipped. Units shipped in fiscal year 2012 increased 13%, or 25 million units, from fiscal year 2011. The
increase in the average selling price to $66 per unit during fiscal year 2012, as compared to $54 per unit in the prior year, was primarily due to
the limited industry supply of hard drives resulting from the severe flooding in Thailand.
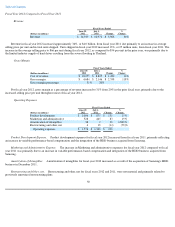
Gross Margin
For fiscal year 2012, gross margin as a percentage of revenue increased to 31% from 20% in the prior fiscal year, primarily due to the
increased selling price per unit throughout most of fiscal year 2012.
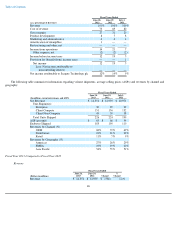
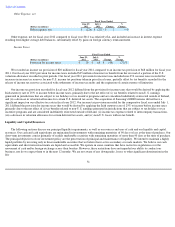
Operating Expenses
Product Development Expense. Product development expenses for fiscal year 2012 increased from fiscal year 2011, primarily reflecting
an increase in variable performance-based compensation and the integration of the HDD business acquired from Samsung.
Marketing and Administrative Expense. The increase in Marketing and administrative expenses for fiscal year 2012 compared to fiscal
year 2011 was primarily due to an increase in variable performance
-based compensation and integration of the HDD business acquired from
Samsung.
Amortization of Intangibles. Amortization of intangibles for fiscal year 2012 increased as a result of the acquisition of Samsung's HDD
business in December 2011.
Restructuring and Other, net. Restructuring and other, net for fiscal years 2012 and 2011, were not material and primarily related to
previously announced restructuring plans.
50
Fiscal Years Ended
(Dollars in millions)
June 29,
2012
July 1,
2011
Change
%
Change
Revenue
$
14,939
$
10,971
$
3,968
36
%
Fiscal Years Ended
(Dollars in millions)
June 29,
2012
July 1,
2011
Change
%
Change
Cost of revenue
$
10,255
$
8,825
$
1,430
16
%
Gross margin
$
4,684
$
2,146
$
2,538
118
%
Gross margin percentage
31
%
20
%
Fiscal Years Ended
(Dollars in millions)
June 29,
2012
July 1,
2011
Change
%
Change
Product development
$
1,006
$
875
$
131
15
%
Marketing and administrative
528
445
83
19
%
Amortization of intangibles
38
2
36
1,800
%
Restructuring and other, net
4
18
(14
)
(78
)%
Operating expenses
$
1,576
$
1,340
$
236