Seagate 2012 Annual Report Download - page 55
Download and view the complete annual report
Please find page 55 of the 2012 Seagate annual report below. You can navigate through the pages in the report by either clicking on the pages listed below, or by using the keyword search tool below to find specific information within the annual report.-
 1
1 -
2
-
3
-
4
-
5
-
6
-
7
-
8
-
9
-
10
-
11
-
12
-
13
-
14
-
15
-
16
-
17
-
18
-
19
-
20
-
21
-
22
-
23
-
24
-
25
-
26
-
27
-
28
-
29
-
30
-
31
-
32
-
33
-
34
-
35
-
36
-
37
-
38
-
39
-
40
-
41
-
42
-
43
-
44
-
 45
45 -
 46
46 -
 47
47 -
 48
48 -
 49
49 -
 50
50 -
 51
51 -
 52
52 -
 53
53 -
 54
54 -
 55
55 -
 56
56 -
 57
57 -
 58
58 -
 59
59 -
 60
60 -
 61
61 -
 62
62 -
 63
63 -
 64
64 -
 65
65 -
66
-
67
-
68
-
69
-
70
-
71
-
72
-
73
-
74
-
75
-
76
-
77
-
78
-
79
-
80
-
81
-
82
-
83
-
84
-
85
-
86
-
87
-
88
-
89
-
90
-
91
-
92
-
93
-
94
-
95
-
96
-
97
-
98
-
99
-
100
-
101
-
102
-
103
-
104
-
105
-
106
-
107
-
108
-
109
-
110
-
111
-
112
-
113
-
114
-
115
-
116
-
117
-
118
-
119
-
120
-
121
-
122
-
123
-
124
-
125
-
126
-
127
-
128
-
129
-
130
-
131
-
132
-
133
-
134
-
135
-
136
-
137
-
138
-
139
-
140
-
141
-
142
-
143
-
144
-
145
-
146
-
147
-
148
-
149
-
150
-
151
-
152
-
153
-
154
-
155
-
156
-
157
-
158
-
159
-
160
-
161
-
162
-
163
-
164
-
165
-
166
-
167
-
168
-
169
-
170
-
171
-
172
-
173
-
174
-
175
-
176
-
177
-
178
-
179
-
180
-
181
-
182
-
183
-
184
-
185
-
186
-
187
-
188
-
189
-
190
-
191
-
192
-
193
-
194
-
195
-
196
-
197
-
198
-
199
-
200
-
201
-
202
-
203
-
204
-
205
-
206
-
207
-
208
-
209
-
210
-
211
-
212
-
213
-
214
-
215
-
216
-
217
-
218
-
219
-
220
-
221
-
222
-
223
 |
 |

Table of Contents
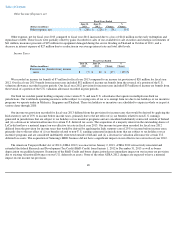
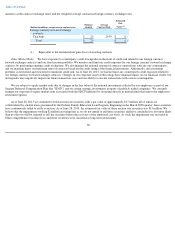
Other Expense, net
Other expense, net for fiscal year 2012 compared to fiscal year 2011 was relatively flat, and included an increase in interest expense
resulting from higher average debt balances, substantially offset by gains on foreign currency remeasurement.
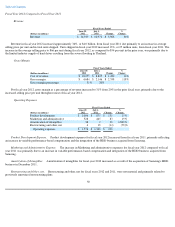
Income Taxes
We recorded an income tax provision of $20 million for fiscal year 2012 compared to an income tax provision of $68 million for fiscal year
2011. Our fiscal year 2012 provision for income taxes included $35 million of income tax benefit from the reversal of a portion of the U.S.
valuation allowance recorded in prior periods. Our fiscal year 2011 provision for income taxes included non-U.S. income taxes recorded for
increases in income tax reserves for non-U.S. income tax positions taken in prior fiscal years, partially offset by tax benefits recorded for the
release of income tax reserves associated with settlements of income tax audits and the expiration of certain statutes of limitation.
Our income tax provision recorded for fiscal year 2012 differed from the provision for income taxes that would be derived by applying the
Irish statutory rate of 25% to income before income taxes, primarily due to the net effect of (i) tax benefits related to non-U.S. earnings
generated in jurisdictions that are subject to tax holidays or tax incentive programs and are considered indefinitely reinvested outside of Ireland,
and (ii) a decrease in valuation allowance for certain U.S. deferred tax assets. The acquisition of Samsung's HDD business did not have a
significant impact on our effective tax rate in fiscal year 2012. Our income tax provision recorded for the comparative fiscal year ended July 1,
2011 differed the provision for income taxes that would be derived by applying the Irish statutory rate of 25% to income before income taxes
primarily due to the net effect of (i) tax benefits related to non-U.S. earnings generated in jurisdictions that are subject to tax holidays or tax
incentive programs and are considered indefinitely reinvested outside of Ireland, (ii) income tax expense related to intercompany transactions,
(iii) a decrease in valuation allowance for certain deferred tax assets, and (iv) non-U.S. losses with no tax benefit.
Liquidity and Capital Resources
The following sections discuss our principal liquidity requirements, as well as our sources and uses of cash and our liquidity and capital
resources. Our cash and cash equivalents are maintained in investments with remaining maturities of 90 days or less at the time of purchase. Our
short-term investments consist primarily of readily marketable securities with remaining maturities of more than 90 days at the time of purchase.
The principal objectives of our investment policy are the preservation of principal and maintenance of liquidity. We intend to maintain a highly
liquid portfolio by investing only in those marketable securities that we believe have active secondary or resale markets. We believe our cash
equivalents and short-term investments are liquid and accessible. We operate in some countries that have restrictive regulations over the
movement of cash and/or foreign exchange across their borders. However, these restrictions have not impeded our ability to conduct our
business, nor do we expect them to in the next 12 months. We are not aware of any downgrades, losses or other significant deterioration in the
fair
51
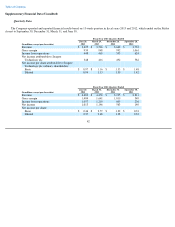
Fiscal Years Ended
(Dollars in millions)
June 29,
2012
July 1,
2011
Change
%
Change
Other expense, net
$
(226
)
$
(227
)
$
1
—
%
Fiscal Years Ended
(Dollars in millions)
June 29,
2012
July 1,
2011
Change
%
Change
Provision for income taxes
$
20
$
68
$
(48
)
(71
)%