Seagate 2012 Annual Report Download - page 50
Download and view the complete annual report
Please find page 50 of the 2012 Seagate annual report below. You can navigate through the pages in the report by either clicking on the pages listed below, or by using the keyword search tool below to find specific information within the annual report.-
 1
1 -
2
-
3
-
4
-
5
-
6
-
7
-
8
-
9
-
10
-
11
-
12
-
13
-
14
-
15
-
16
-
17
-
18
-
19
-
20
-
21
-
22
-
23
-
24
-
25
-
26
-
27
-
28
-
29
-
30
-
31
-
32
-
33
-
34
-
35
-
36
-
37
-
38
-
39
-
 40
40 -
 41
41 -
 42
42 -
 43
43 -
 44
44 -
 45
45 -
 46
46 -
 47
47 -
 48
48 -
 49
49 -
 50
50 -
 51
51 -
 52
52 -
 53
53 -
 54
54 -
 55
55 -
 56
56 -
 57
57 -
 58
58 -
 59
59 -
 60
60 -
61
-
62
-
63
-
64
-
65
-
66
-
67
-
68
-
69
-
70
-
71
-
72
-
73
-
74
-
75
-
76
-
77
-
78
-
79
-
80
-
81
-
82
-
83
-
84
-
85
-
86
-
87
-
88
-
89
-
90
-
91
-
92
-
93
-
94
-
95
-
96
-
97
-
98
-
99
-
100
-
101
-
102
-
103
-
104
-
105
-
106
-
107
-
108
-
109
-
110
-
111
-
112
-
113
-
114
-
115
-
116
-
117
-
118
-
119
-
120
-
121
-
122
-
123
-
124
-
125
-
126
-
127
-
128
-
129
-
130
-
131
-
132
-
133
-
134
-
135
-
136
-
137
-
138
-
139
-
140
-
141
-
142
-
143
-
144
-
145
-
146
-
147
-
148
-
149
-
150
-
151
-
152
-
153
-
154
-
155
-
156
-
157
-
158
-
159
-
160
-
161
-
162
-
163
-
164
-
165
-
166
-
167
-
168
-
169
-
170
-
171
-
172
-
173
-
174
-
175
-
176
-
177
-
178
-
179
-
180
-
181
-
182
-
183
-
184
-
185
-
186
-
187
-
188
-
189
-
190
-
191
-
192
-
193
-
194
-
195
-
196
-
197
-
198
-
199
-
200
-
201
-
202
-
203
-
204
-
205
-
206
-
207
-
208
-
209
-
210
-
211
-
212
-
213
-
214
-
215
-
216
-
217
-
218
-
219
-
220
-
221
-
222
-
223
 |
 |

Table of Contents
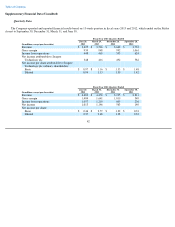
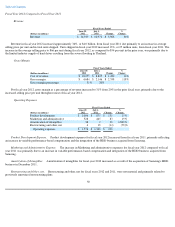
The following table summarizes information regarding volume shipments, average selling prices (ASPs) and revenues by channel and
geography:
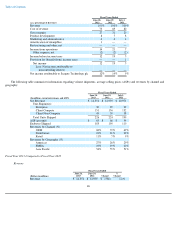
Fiscal Year 2013 Compared to Fiscal Year 2012
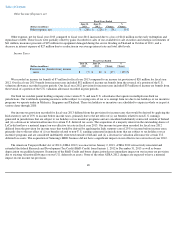
Revenue
46
Fiscal Years Ended
(as a percentage of Revenue)
June 28,
2013
June 29,
2012
July 1,
2011
Revenue
100
%
100
%
100
%
Cost of revenue
73
69
80
Gross margin
27
31
20
Product development
8
7
8
Marketing and administrative
4
4
4
Amortization of intangibles
1
—
—
Restructuring and other, net
—
—
—
Income from operations
14
21
7
Other expense, net
(2
)
(2
)
(2
)
Income before income taxes
12
19
5
Provision for (benefit from) income taxes
—
—
1
Net income
12
19
5
Less: Net income attributable to
noncontrolling interest
—
—
—
Net income attributable to Seagate Technology plc
12
%
19
%
5
%
Fiscal Years Ended
(In millions, except percentages and ASPs)
June 28,
2013
June 29,
2012
July 1,
2011
Net Revenue
$
14,351
$
14,939
$
10,971
Unit Shipments:
Enterprise
30
29
29
Client Compute
151
156
132
Client Non
-
Compute
45
39
38
Total Units Shipped
226
224
199
ASP (per unit)
$
63
$
66
$
54
Exabytes Shipped
185
150
110
Revenues by Channel (%)
OEM
68
%
72
%
69
%
Distributors
21
%
21
%
22
%
Retail
11
%
7
%
9
%
Revenues by Geography (%)
Americas
27
%
26
%
29
%
EMEA
19
%
19
%
20
%
Asia Pacific
54
%
55
%
51
%
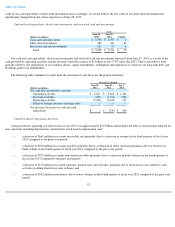
Fiscal Years Ended
(Dollars in millions)
June 28,
2013
June 29,
2012
Change
%
Change
Revenue
$
14,351
$
14,939
$
(588
)
(4
)%