Seagate 2012 Annual Report Download - page 61
Download and view the complete annual report
Please find page 61 of the 2012 Seagate annual report below. You can navigate through the pages in the report by either clicking on the pages listed below, or by using the keyword search tool below to find specific information within the annual report.-
 1
1 -
2
-
3
-
4
-
5
-
6
-
7
-
8
-
9
-
10
-
11
-
12
-
13
-
14
-
15
-
16
-
17
-
18
-
19
-
20
-
21
-
22
-
23
-
24
-
25
-
26
-
27
-
28
-
29
-
30
-
31
-
32
-
33
-
34
-
35
-
36
-
37
-
38
-
39
-
40
-
41
-
42
-
43
-
44
-
45
-
46
-
47
-
48
-
49
-
50
-
 51
51 -
 52
52 -
 53
53 -
 54
54 -
 55
55 -
 56
56 -
 57
57 -
 58
58 -
 59
59 -
 60
60 -
 61
61 -
 62
62 -
 63
63 -
 64
64 -
 65
65 -
 66
66 -
 67
67 -
 68
68 -
 69
69 -
 70
70 -
 71
71 -
72
-
73
-
74
-
75
-
76
-
77
-
78
-
79
-
80
-
81
-
82
-
83
-
84
-
85
-
86
-
87
-
88
-
89
-
90
-
91
-
92
-
93
-
94
-
95
-
96
-
97
-
98
-
99
-
100
-
101
-
102
-
103
-
104
-
105
-
106
-
107
-
108
-
109
-
110
-
111
-
112
-
113
-
114
-
115
-
116
-
117
-
118
-
119
-
120
-
121
-
122
-
123
-
124
-
125
-
126
-
127
-
128
-
129
-
130
-
131
-
132
-
133
-
134
-
135
-
136
-
137
-
138
-
139
-
140
-
141
-
142
-
143
-
144
-
145
-
146
-
147
-
148
-
149
-
150
-
151
-
152
-
153
-
154
-
155
-
156
-
157
-
158
-
159
-
160
-
161
-
162
-
163
-
164
-
165
-
166
-
167
-
168
-
169
-
170
-
171
-
172
-
173
-
174
-
175
-
176
-
177
-
178
-
179
-
180
-
181
-
182
-
183
-
184
-
185
-
186
-
187
-
188
-
189
-
190
-
191
-
192
-
193
-
194
-
195
-
196
-
197
-
198
-
199
-
200
-
201
-
202
-
203
-
204
-
205
-
206
-
207
-
208
-
209
-
210
-
211
-
212
-
213
-
214
-
215
-
216
-
217
-
218
-
219
-
220
-
221
-
222
-
223
 |
 |

Table of Contents
industry supply-demand balance as well as other factors may result in a more competitive pricing environment and may cause sales programs as
a percentage of gross revenue to increase from the current or historical levels. If such rebates and incentives trend upwards, revenues and
margins will be reduced.
Establishment of Warranty Accruals. We estimate probable product warranty costs at the time revenue is recognized. We generally
warrant our products for a period of 1 to 5 years. Our warranty provision considers estimated product failure rates and trends (including the
timing of product returns during the warranty periods), and estimated repair or replacement costs related to product quality issues, if any. We
also exercise judgment in estimating our ability to sell certain repaired disk drives. Should actual experience in any future period differ
significantly from our estimates, our future results of operations could be materially affected. Our judgment is subject to a greater degree of
subjectivity with respect to newly introduced products because of limited experience with those products upon which to base our warranty
estimates.
The actual results with regard to warranty expenditures could have an adverse or favorable effect on our results of operations if the actual
rate of unit failure, the cost to repair a unit, or the actual cost required to satisfy customer claims differs from those estimates we used in
determining the warranty accrual. Since we typically outsource our warranty repairs, our repair cost is subject to periodic negotiations with
vendors and may vary from our estimates. We also exercise judgment in estimating our ability to sell certain repaired disk drives. To the extent
such sales fall below our forecast, warranty cost will be adversely impacted.
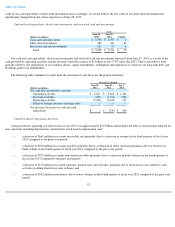
We review our warranty accrual quarterly for products shipped in prior periods and which are still under warranty. Any changes in the
estimates underlying the accrual may result in adjustments that impact the current period gross margins and income. In fiscal years 2013, 2012
and 2011 net changes in estimates of prior warranty accruals as a percentage of revenue were immaterial. Our total warranty cost was 1.6%,
1.5% and 1.8% of revenue during fiscal years 2013, 2012 and 2011, respectively, while warranty cost related to new shipments (exclusive of the
impact of re-estimates of pre-existing liabilities) were 1.3%, 1.1% and 1.8% respectively, for the same periods. Changes in anticipated failure
rates of specific products and significant changes in repair or replacement costs have historically been the major reasons for significant changes
in prior estimates. Any future changes in failure rates of certain products, as well as changes in repair costs or the cost of replacement parts, may
result in increased or decreased warranty accruals.
Accounting for Income Taxes.
We account for income taxes pursuant to Accounting Standards Codification (ASC) Topic 740 (ASC 740),
Income Taxes. In applying, ASC 740, we make certain estimates and judgments in determining income tax expense for financial statement
purposes. These estimates and judgments occur in the calculation of tax credits, recognition of income and deductions and calculation of specific
tax assets and liabilities, which arise from differences in the timing of recognition of revenue and expense for tax and financial statement
purposes, as well as tax liabilities associated with uncertain tax positions. The calculation of tax liabilities involves uncertainties in the
application of complex tax rules and the potential for future adjustment of our uncertain tax positions by the Internal Revenue Service or other
tax jurisdictions. If estimates of these tax liabilities are greater or less than actual results, an additional tax benefit or provision will result. The
deferred tax assets we record each period depend primarily on our ability to generate future taxable income in the United States and certain non-
U.S. jurisdictions. Each period, we evaluate the need for a valuation allowance for our deferred tax assets and, if necessary, we adjust the
valuation allowance so that net deferred tax assets are recorded only to the extent we conclude it is more likely than not that these deferred tax
assets will be realized. If our outlook for future taxable income changes significantly, our assessment of the need for a valuation allowance may
also change.
Assessing Goodwill and Other Long-lived Assets for Impairment. We account for goodwill in accordance with ASC 350, Intangibles—
Goodwill and Other . As permitted by ASC 350, we perform a qualitative assessment in determining whether the existence of events or
circumstances leads to a determination that it is more likely than not that the fair value of a reporting unit is less than its carrying
57