Seagate 2012 Annual Report Download - page 110
Download and view the complete annual report
Please find page 110 of the 2012 Seagate annual report below. You can navigate through the pages in the report by either clicking on the pages listed below, or by using the keyword search tool below to find specific information within the annual report.-
 1
1 -
2
-
3
-
4
-
5
-
6
-
7
-
8
-
9
-
10
-
11
-
12
-
13
-
14
-
15
-
16
-
17
-
18
-
19
-
20
-
21
-
22
-
23
-
24
-
25
-
26
-
27
-
28
-
29
-
30
-
31
-
32
-
33
-
34
-
35
-
36
-
37
-
38
-
39
-
40
-
41
-
42
-
43
-
44
-
45
-
46
-
47
-
48
-
49
-
50
-
51
-
52
-
53
-
54
-
55
-
56
-
57
-
58
-
59
-
60
-
61
-
62
-
63
-
64
-
65
-
66
-
67
-
68
-
69
-
70
-
71
-
72
-
73
-
74
-
75
-
76
-
77
-
78
-
79
-
80
-
81
-
82
-
83
-
84
-
85
-
86
-
87
-
88
-
89
-
90
-
91
-
92
-
93
-
94
-
95
-
96
-
97
-
98
-
99
-
 100
100 -
 101
101 -
 102
102 -
 103
103 -
 104
104 -
 105
105 -
 106
106 -
 107
107 -
 108
108 -
 109
109 -
 110
110 -
 111
111 -
 112
112 -
 113
113 -
 114
114 -
 115
115 -
 116
116 -
 117
117 -
 118
118 -
 119
119 -
 120
120 -
121
-
122
-
123
-
124
-
125
-
126
-
127
-
128
-
129
-
130
-
131
-
132
-
133
-
134
-
135
-
136
-
137
-
138
-
139
-
140
-
141
-
142
-
143
-
144
-
145
-
146
-
147
-
148
-
149
-
150
-
151
-
152
-
153
-
154
-
155
-
156
-
157
-
158
-
159
-
160
-
161
-
162
-
163
-
164
-
165
-
166
-
167
-
168
-
169
-
170
-
171
-
172
-
173
-
174
-
175
-
176
-
177
-
178
-
179
-
180
-
181
-
182
-
183
-
184
-
185
-
186
-
187
-
188
-
189
-
190
-
191
-
192
-
193
-
194
-
195
-
196
-
197
-
198
-
199
-
200
-
201
-
202
-
203
-
204
-
205
-
206
-
207
-
208
-
209
-
210
-
211
-
212
-
213
-
214
-
215
-
216
-
217
-
218
-
219
-
220
-
221
-
222
-
223
 |
 |

Table of Contents
SEAGATE TECHNOLOGY PLC
NOTES TO CONSOLIDATED FINANCIAL STATEMENTS—(Continued)
in Restricted cash and investments in the Consolidated Balance Sheets. The deferred compensation obligation related to the rabbi trust included
in Accrued expenses on the accompanying Consolidated Balance Sheets was approximately $87 million and $82 million as of June 28, 2013 and
June 29, 2012, respectively.
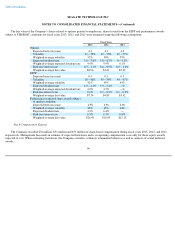
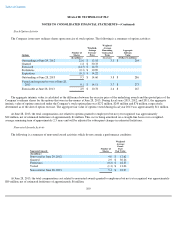
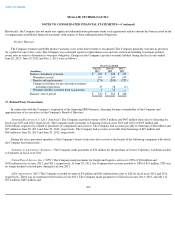
12. Earnings Per Share
The following table sets forth the computation of basic and diluted net income per share:
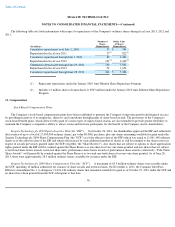
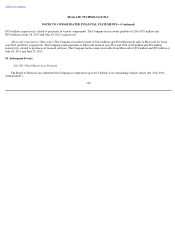
The following potential shares were excluded from the computation of diluted net income per share as their effect would have been anti-
dilutive:
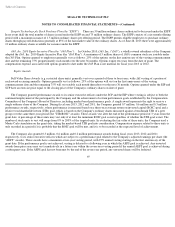
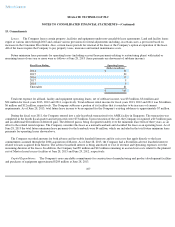
13. Business Segment and Geographic Information
The Company has concluded that its manufacture and distribution of disk drives constitutes one reporting segment. The Company's
manufacturing operations are based on technology platforms that are used to produce various disk drive products that serve multiple disk drive
applications and markets. The Company's main technology platforms are primarily focused around areal density of media and read/write head
technologies. In addition, the Company also invests in certain other technology platforms including motors, servo formatting read/write
channels, solid state and other technologies. The Company has determined that its Chief Executive Officer is the Company's chief operating
decision maker (CODM) as he is responsible for reviewing and approving investments in the Company's technology platforms and
manufacturing infrastructure.
In fiscal years 2013, 2012 and 2011, Dell Inc. accounted for approximately 13%, 15% and 13% of consolidated revenue, respectively, while
Hewlett-
Packard Company accounted for approximately 10%, 14% and 15% of consolidated revenue, respectively. No other customer accounted
for more than 10% of consolidated revenue in any year presented.
102
Fiscal Years Ended
(In millions, except per share data)
June 28,
2013
June 29,
2012
July 1,
2011
Numerator:
Net income attributable to Seagate Technology plc
$
1,838
$
2,862
$
511
Number of shares used in per share calculations:
Total shares for purposes of calculating basic net income per share
attributable to Seagate Technology plc
370
426
451
Weighted
-
average effect of dilutive securities:
Employee equity award plans
12
15
16
Total shares for purpose of calculating diluted net income per share
attributable to Seagate Technology plc
382
441
467
Net income per share attributable to Seagate Technology plc
shareholders:
Basic
$
4.97
$
6.72
$
1.13
Diluted
$
4.81
$
6.49
$
1.09
Fiscal Years Ended
(In millions)
June 28,
2013
June 29,
2012
July 1,
2011
Employee equity award plans
—
7
15