Seagate 2012 Annual Report Download - page 40
Download and view the complete annual report
Please find page 40 of the 2012 Seagate annual report below. You can navigate through the pages in the report by either clicking on the pages listed below, or by using the keyword search tool below to find specific information within the annual report.-
 1
1 -
2
-
3
-
4
-
5
-
6
-
7
-
8
-
9
-
10
-
11
-
12
-
13
-
14
-
15
-
16
-
17
-
18
-
19
-
20
-
21
-
22
-
23
-
24
-
25
-
26
-
27
-
28
-
29
-
 30
30 -
 31
31 -
 32
32 -
 33
33 -
 34
34 -
 35
35 -
 36
36 -
 37
37 -
 38
38 -
 39
39 -
 40
40 -
 41
41 -
 42
42 -
 43
43 -
 44
44 -
 45
45 -
 46
46 -
 47
47 -
 48
48 -
 49
49 -
 50
50 -
51
-
52
-
53
-
54
-
55
-
56
-
57
-
58
-
59
-
60
-
61
-
62
-
63
-
64
-
65
-
66
-
67
-
68
-
69
-
70
-
71
-
72
-
73
-
74
-
75
-
76
-
77
-
78
-
79
-
80
-
81
-
82
-
83
-
84
-
85
-
86
-
87
-
88
-
89
-
90
-
91
-
92
-
93
-
94
-
95
-
96
-
97
-
98
-
99
-
100
-
101
-
102
-
103
-
104
-
105
-
106
-
107
-
108
-
109
-
110
-
111
-
112
-
113
-
114
-
115
-
116
-
117
-
118
-
119
-
120
-
121
-
122
-
123
-
124
-
125
-
126
-
127
-
128
-
129
-
130
-
131
-
132
-
133
-
134
-
135
-
136
-
137
-
138
-
139
-
140
-
141
-
142
-
143
-
144
-
145
-
146
-
147
-
148
-
149
-
150
-
151
-
152
-
153
-
154
-
155
-
156
-
157
-
158
-
159
-
160
-
161
-
162
-
163
-
164
-
165
-
166
-
167
-
168
-
169
-
170
-
171
-
172
-
173
-
174
-
175
-
176
-
177
-
178
-
179
-
180
-
181
-
182
-
183
-
184
-
185
-
186
-
187
-
188
-
189
-
190
-
191
-
192
-
193
-
194
-
195
-
196
-
197
-
198
-
199
-
200
-
201
-
202
-
203
-
204
-
205
-
206
-
207
-
208
-
209
-
210
-
211
-
212
-
213
-
214
-
215
-
216
-
217
-
218
-
219
-
220
-
221
-
222
-
223
 |
 |

Table of Contents
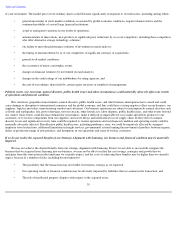
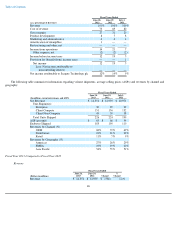
Our material manufacturing, product development and marketing and administrative facilities at June 28, 2013 are as follows:
As of June 28, 2013, we owned or leased a total of approximately 11.4 million square feet of space worldwide. We occupied approximately
7.0 million square feet for the purpose of manufacturing, 1.9 million square feet for product development, 1.6 million square feet for marketing
and administrative purposes and subleased 0.2 million square feet. Included in the 11.4 million square feet of owned or leased space is a total of
0.9 million square feet that is currently unoccupied, primarily as a result of site closures at our facilities in Longmont, Colorado and Ang Mo Kio
(AMK), Singapore. We believe that our existing properties are in good operating condition and are suitable and adequate for the operations for
which they are used. As of June 28, 2013, all of our material manufacturing facilities are operating at normal utilization levels and none of our
manufacturing facilities are experiencing significant underutilization.
ITEM 3. LEGAL PROCEEDINGS
See Item 8. Financial Statements and Supplementary Data—Note 14, Legal, Environmental, and Other Contingencies.
ITEM 4. MINE SAFETY DISCLOSURES
Not applicable.
37
Location
Building(s)
Owned or Leased
Approximate
Square Footage
Primary Use
United States
California
Owned/Leased
895,000
Product development and marketing and
administrative
Colorado
Owned
528,000
Product development
Minnesota
Owned/Leased
1,085,000
Manufacture of recording heads and product
development
Oklahoma
Owned/Leased
150,000
Administrative
Europe
Northern
Ireland
Springtown
Owned
479,000
Manufacture of recording heads
Asia
China
Suzhou
Owned
(1)
1,103,000
Manufacture of drives
Wuxi
Leased
716,000
Manufacture of drives and drive subassemblies
Malaysia
Johor
Owned
(1)
631,000
Manufacture of substrates
Penang
Owned
(1)
390,000
Manufacture of drive subassemblies
Singapore
Woodlands
Owned
(1)
1,404,000
Manufacture of media
Ang Mo Kio
Leased
258,000
Manufacturing support, product development and
administrative
Science Park
Leased
110,000
Product development
Thailand
Korat
Owned
1,716,000
Manufacture of drives and drive subassemblies
Teparuk
Owned
362,000
Manufacture of drive subassemblies
Korea
Suwon
Owned
220,000
Product development
(1)
Land leases for these facilities expire at varying dates through 2067.