Seagate 2010 Annual Report Download - page 75
Download and view the complete annual report
Please find page 75 of the 2010 Seagate annual report below. You can navigate through the pages in the report by either clicking on the pages listed below, or by using the keyword search tool below to find specific information within the annual report.-
 1
1 -
2
-
3
-
4
-
5
-
6
-
7
-
8
-
9
-
10
-
11
-
12
-
13
-
14
-
15
-
16
-
17
-
18
-
19
-
20
-
21
-
22
-
23
-
24
-
25
-
26
-
27
-
28
-
29
-
30
-
31
-
32
-
33
-
34
-
35
-
36
-
37
-
38
-
39
-
40
-
41
-
42
-
43
-
44
-
45
-
46
-
47
-
48
-
49
-
50
-
51
-
52
-
53
-
54
-
55
-
56
-
57
-
58
-
59
-
60
-
61
-
62
-
63
-
64
-
 65
65 -
 66
66 -
 67
67 -
 68
68 -
 69
69 -
 70
70 -
 71
71 -
 72
72 -
 73
73 -
 74
74 -
 75
75 -
 76
76 -
 77
77 -
 78
78 -
 79
79 -
 80
80 -
 81
81 -
 82
82 -
 83
83 -
 84
84 -
 85
85 -
86
-
87
-
88
-
89
-
90
-
91
-
92
-
93
-
94
-
95
-
96
-
97
-
98
-
99
-
100
-
101
-
102
-
103
-
104
-
105
-
106
-
107
-
108
-
109
-
110
-
111
-
112
-
113
-
114
-
115
-
116
-
117
-
118
-
119
-
120
-
121
-
122
-
123
-
124
-
125
-
126
-
127
-
128
-
129
-
130
-
131
-
132
-
133
-
134
-
135
-
136
-
137
-
138
-
139
-
140
-
141
-
142
-
143
-
144
-
145
-
146
-
147
-
148
-
149
-
150
-
151
-
152
-
153
-
154
-
155
-
156
-
157
-
158
-
159
-
160
-
161
-
162
-
163
-
164
-
165
-
166
-
167
-
168
-
169
-
170
-
171
-
172
-
173
-
174
-
175
-
176
-
177
-
178
-
179
-
180
-
181
-
182
-
183
-
184
-
185
-
186
-
187
-
188
-
189
-
190
-
191
-
192
-
193
-
194
-
195
-
196
-
197
-
198
-
199
-
200
-
201
-
202
-
203
-
204
-
205
-
206
-
207
-
208
-
209
-
210
-
211
-
212
-
213
-
214
-
215
-
216
-
217
-
218
-
219
-
220
-
221
-
222
-
223
-
224
-
225
-
226
-
227
-
228
-
229
-
230
-
231
-
232
-
233
-
234
-
235
-
236
-
237
-
238
-
239
-
240
-
241
-
242
-
243
-
244
-
245
-
246
-
247
-
248
-
249
-
250
-
251
-
252
-
253
-
254
-
255
-
256
-
257
-
258
-
259
-
260
-
261
-
262
-
263
-
264
-
265
-
266
-
267
-
268
-
269
-
270
-
271
-
272
-
273
-
274
-
275
-
276
-
277
-
278
-
279
-
280
-
281
-
282
-
283
-
284
-
285
 |
 |

Table of Contents
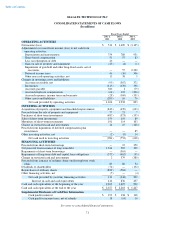
SEAGATE TECHNOLOGY PLC
CONSOLIDATED STATEMENTS OF CASH FLOWS
(In millions)
See notes to consolidated financial statements.
71
Fiscal Years Ended
July 1,
2011
July 2,
2010
July 3,
2009
OPERATING ACTIVITIES
Net income (loss)
$
511
$
1,609
$
(3,125
)
Adjustments to reconcile net income (loss) to net cash from
operating activities:
Depreciation and amortization
754
780
931
Share
-
based compensation
51
57
83
Loss on redemption of debt
26
—
—
Gain on sale of property and equipment
(23
)
(4
)
(1
)
Impairment of goodwill and other long
-
lived assets, net of
recoveries
—
57
2,320
Deferred income taxes
46
(36
)
306
Other non
-
cash operating activities, net
15
38
9
Changes in operating assets and liabilities:
Accounts receivable, net
(95
)
(367
)
372
Inventories
(115
)
(170
)
358
Accounts payable
386
2
(79
)
Accrued employee compensation
(64
)
119
(296
)
Accrued expenses, income taxes and warranty
(28
)
(169
)
(131
)
Other assets and liabilities
(200
)
16
76
Net cash provided by operating activities
1,264
1,932
823
INVESTING ACTIVITIES
Acquisition of property, equipment and leasehold improvements
(843
)
(639
)
(633
)
Proceeds from the sale of property and equipment
77
21
7
Purchases of short
-
term investments
(487
)
(373
)
(155
)
Sales of short
-
term investments
159
119
89
Maturities of short
-
term investments
101
114
103
Change in restricted cash and investments
14
15
(128
)
Proceeds from liquidation of deferred compensation plan
investments
—
—
85
Other investing activities, net
(2
)
(9
)
14
Net cash used in investing activities
(981
)
(752
)
(618
)
FINANCING ACTIVITIES
Proceeds from short
-
term borrowings
—
15
350
Net proceeds from issuance of long
-
term debt
1,324
587
399
Repayments of short
-
term borrowings
—
(
365
)
—
Repayments of long
-
term debt and capital lease obligations
(377
)
(462
)
(55
)
Change in restricted cash and investments
2
379
(380
)
Proceeds from issuance of ordinary shares under employee stock
plans
83
86
54
Dividends to shareholders
(74
)
—
(
132
)
Repurchases of ordinary shares
(822
)
(584
)
—
Other financing activities, net
(5
)
—
(
4
)
Net cash provided by (used in) financing activities
131
(344
)
232
Increase in cash and cash equivalents
414
836
437
Cash and cash equivalents at the beginning of the year
2,263
1,427
990
Cash and cash equivalents at the end of the year
$
2,677
$
2,263
$
1,427
Supplemental Disclosure of Cash Flow Information
Cash paid for interest
$
193
$
138
$
118
Cash paid for income taxes, net of refunds
18
(14
)
10