Seagate 2010 Annual Report Download - page 63
Download and view the complete annual report
Please find page 63 of the 2010 Seagate annual report below. You can navigate through the pages in the report by either clicking on the pages listed below, or by using the keyword search tool below to find specific information within the annual report.-
 1
1 -
2
-
3
-
4
-
5
-
6
-
7
-
8
-
9
-
10
-
11
-
12
-
13
-
14
-
15
-
16
-
17
-
18
-
19
-
20
-
21
-
22
-
23
-
24
-
25
-
26
-
27
-
28
-
29
-
30
-
31
-
32
-
33
-
34
-
35
-
36
-
37
-
38
-
39
-
40
-
41
-
42
-
43
-
44
-
45
-
46
-
47
-
48
-
49
-
50
-
51
-
52
-
 53
53 -
 54
54 -
 55
55 -
 56
56 -
 57
57 -
 58
58 -
 59
59 -
 60
60 -
 61
61 -
 62
62 -
 63
63 -
 64
64 -
 65
65 -
 66
66 -
 67
67 -
 68
68 -
 69
69 -
 70
70 -
 71
71 -
 72
72 -
 73
73 -
74
-
75
-
76
-
77
-
78
-
79
-
80
-
81
-
82
-
83
-
84
-
85
-
86
-
87
-
88
-
89
-
90
-
91
-
92
-
93
-
94
-
95
-
96
-
97
-
98
-
99
-
100
-
101
-
102
-
103
-
104
-
105
-
106
-
107
-
108
-
109
-
110
-
111
-
112
-
113
-
114
-
115
-
116
-
117
-
118
-
119
-
120
-
121
-
122
-
123
-
124
-
125
-
126
-
127
-
128
-
129
-
130
-
131
-
132
-
133
-
134
-
135
-
136
-
137
-
138
-
139
-
140
-
141
-
142
-
143
-
144
-
145
-
146
-
147
-
148
-
149
-
150
-
151
-
152
-
153
-
154
-
155
-
156
-
157
-
158
-
159
-
160
-
161
-
162
-
163
-
164
-
165
-
166
-
167
-
168
-
169
-
170
-
171
-
172
-
173
-
174
-
175
-
176
-
177
-
178
-
179
-
180
-
181
-
182
-
183
-
184
-
185
-
186
-
187
-
188
-
189
-
190
-
191
-
192
-
193
-
194
-
195
-
196
-
197
-
198
-
199
-
200
-
201
-
202
-
203
-
204
-
205
-
206
-
207
-
208
-
209
-
210
-
211
-
212
-
213
-
214
-
215
-
216
-
217
-
218
-
219
-
220
-
221
-
222
-
223
-
224
-
225
-
226
-
227
-
228
-
229
-
230
-
231
-
232
-
233
-
234
-
235
-
236
-
237
-
238
-
239
-
240
-
241
-
242
-
243
-
244
-
245
-
246
-
247
-
248
-
249
-
250
-
251
-
252
-
253
-
254
-
255
-
256
-
257
-
258
-
259
-
260
-
261
-
262
-
263
-
264
-
265
-
266
-
267
-
268
-
269
-
270
-
271
-
272
-
273
-
274
-
275
-
276
-
277
-
278
-
279
-
280
-
281
-
282
-
283
-
284
-
285
 |
 |

Table of Contents
becoming an Irish tax resident in fiscal year 2010. Our Irish tax resident parent holding company owns various U.S. and non-U.S. subsidiaries
that operate in multiple non-Irish taxing jurisdictions. Our worldwide operating income is either subject to varying rates of tax or is exempt from
tax due to tax holidays or tax incentive programs we operate under in China, Malaysia, Singapore, Switzerland and Thailand. These tax holidays
or incentives are scheduled to expire in whole or in part at various dates through 2020.
Since we became an Irish tax resident in fiscal year 2010, the Irish statutory rate of 25% is used for purposes of the reconciliation between
the provision for income taxes at the statutory rate and our effective tax rate. For fiscal years 2009, a notional 35% statutory rate was used.
Our income tax benefit recorded for fiscal year 2010 differed from the provision (benefit) for income taxes that would be derived by
applying the Irish statutory rate of 25% to income before income taxes primarily due to the net effect of (i) tax benefits related to non-U.S.
earnings generated in jurisdictions that are subject to tax holidays or tax incentive programs and are considered indefinitely reinvested outside of
Ireland, (ii) a decrease in valuation allowance for certain deferred tax assets, (iii) non-
U.S. losses with no tax benefit, and (iv) tax expense related
to intercompany transactions. Our provision for income taxes recorded for the comparative fiscal year ended July 3, 2009 differed from the
provision for income taxes that would be derived by applying a notional U.S. 35% rate to income before income taxes primarily due to the net
effect of (i) non-deductible goodwill impairments, (ii) an increase in our valuation allowance for certain deferred tax assets, (iii) non-U.S. losses
with no tax benefit, (iv) tax benefits related to tax holiday and tax incentive programs, and (v) tax expense related to intercompany transactions.
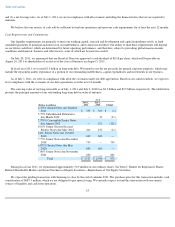
Liquidity and Capital Resources
The following sections discuss our principal liquidity requirements, as well as our sources and uses of cash and our liquidity and capital
resources. Our cash and cash equivalents are maintained in highly liquid investments with remaining maturities of 90 days or less at the time of
purchase. Our short-term investments consist primarily of readily marketable debt securities with remaining maturities of more than 90 days at
the time of purchase. The principal objectives of our investment policy are the preservation of principal and maintenance of liquidity. We
attempt to mitigate default risk by investing in high-quality investment grade securities, limiting the time to maturity and by monitoring the
counter-parties and underlying obligors closely. We monitor our investment portfolio and position our portfolio to respond appropriately to a
reduction in credit rating of any investment issuer, guarantor or depository. We intend to maintain a highly liquid portfolio by investing only in
those marketable securities that we believe have active secondary or resale markets. We believe our cash equivalents and short-term investments
are liquid and accessible. We operate in some countries that may have restrictive regulations over the movement of cash and/or foreign exchange
across their borders. These restrictions have not impeded our ability to conduct business in those countries, nor do we expect them to in the next
12 months. We are not aware of any downgrades, losses or other significant deterioration in the fair value of our cash equivalents or short-term
investments and accordingly, we do not believe the fair value of our short-term investments has significantly changed from the values reported
as of July 1, 2011.
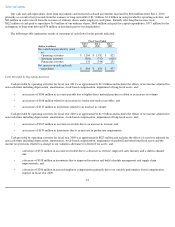
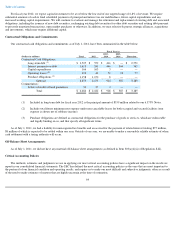
Cash and cash equivalents, short-term investments, and restricted cash and investments
60
As of
(Dollars in millions)
July 1,
2011
July 2,
2010
Change
Cash and cash equivalents
$
2,677
$
2,263
$
414
Short
-
term investments
474
252
222
Restricted cash and investments
102
114
(12
)
Total
$
3,253
$
2,629
$
624