Seagate 2010 Annual Report Download - page 57
Download and view the complete annual report
Please find page 57 of the 2010 Seagate annual report below. You can navigate through the pages in the report by either clicking on the pages listed below, or by using the keyword search tool below to find specific information within the annual report.-
 1
1 -
2
-
3
-
4
-
5
-
6
-
7
-
8
-
9
-
10
-
11
-
12
-
13
-
14
-
15
-
16
-
17
-
18
-
19
-
20
-
21
-
22
-
23
-
24
-
25
-
26
-
27
-
28
-
29
-
30
-
31
-
32
-
33
-
34
-
35
-
36
-
37
-
38
-
39
-
40
-
41
-
42
-
43
-
44
-
45
-
46
-
 47
47 -
 48
48 -
 49
49 -
 50
50 -
 51
51 -
 52
52 -
 53
53 -
 54
54 -
 55
55 -
 56
56 -
 57
57 -
 58
58 -
 59
59 -
 60
60 -
 61
61 -
 62
62 -
 63
63 -
 64
64 -
 65
65 -
 66
66 -
 67
67 -
68
-
69
-
70
-
71
-
72
-
73
-
74
-
75
-
76
-
77
-
78
-
79
-
80
-
81
-
82
-
83
-
84
-
85
-
86
-
87
-
88
-
89
-
90
-
91
-
92
-
93
-
94
-
95
-
96
-
97
-
98
-
99
-
100
-
101
-
102
-
103
-
104
-
105
-
106
-
107
-
108
-
109
-
110
-
111
-
112
-
113
-
114
-
115
-
116
-
117
-
118
-
119
-
120
-
121
-
122
-
123
-
124
-
125
-
126
-
127
-
128
-
129
-
130
-
131
-
132
-
133
-
134
-
135
-
136
-
137
-
138
-
139
-
140
-
141
-
142
-
143
-
144
-
145
-
146
-
147
-
148
-
149
-
150
-
151
-
152
-
153
-
154
-
155
-
156
-
157
-
158
-
159
-
160
-
161
-
162
-
163
-
164
-
165
-
166
-
167
-
168
-
169
-
170
-
171
-
172
-
173
-
174
-
175
-
176
-
177
-
178
-
179
-
180
-
181
-
182
-
183
-
184
-
185
-
186
-
187
-
188
-
189
-
190
-
191
-
192
-
193
-
194
-
195
-
196
-
197
-
198
-
199
-
200
-
201
-
202
-
203
-
204
-
205
-
206
-
207
-
208
-
209
-
210
-
211
-
212
-
213
-
214
-
215
-
216
-
217
-
218
-
219
-
220
-
221
-
222
-
223
-
224
-
225
-
226
-
227
-
228
-
229
-
230
-
231
-
232
-
233
-
234
-
235
-
236
-
237
-
238
-
239
-
240
-
241
-
242
-
243
-
244
-
245
-
246
-
247
-
248
-
249
-
250
-
251
-
252
-
253
-
254
-
255
-
256
-
257
-
258
-
259
-
260
-
261
-
262
-
263
-
264
-
265
-
266
-
267
-
268
-
269
-
270
-
271
-
272
-
273
-
274
-
275
-
276
-
277
-
278
-
279
-
280
-
281
-
282
-
283
-
284
-
285
 |
 |

Table of Contents
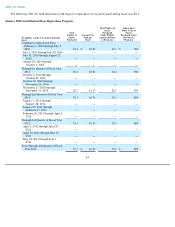
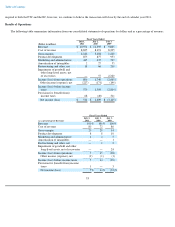
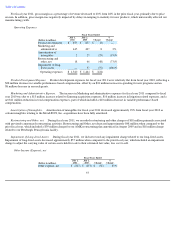
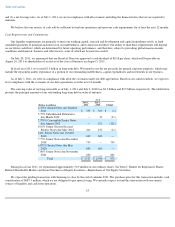
The following table summarizes information regarding volume shipments, average selling prices (ASPs) and revenues by channel and
geography:
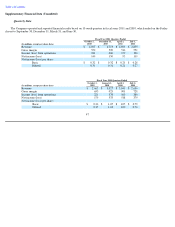
Fiscal Year 2011 Compared to Fiscal Year 2010
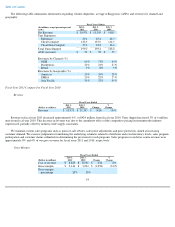
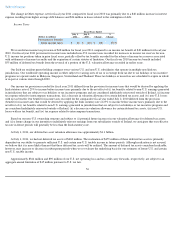
Revenue
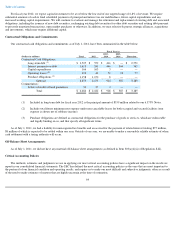
Revenue in fiscal year 2011 decreased approximately 4%, or $424 million, from fiscal year 2010. Units shipped increased 3% or 6 million
units from fiscal year 2010. This decrease in revenue was due to the cumulative effect of the competitive pricing environment the industry
experienced, partially offset by industry-wide supply constraints.
We maintain various sales programs such as point-of-sale rebates, sales price adjustments and price protection, aimed at increasing
customer demand. We exercise judgment in formulating the underlying estimates related to distributor and retail inventory levels, sales program
participation and customer claims submittals in determining the provision for such programs. Sales programs recorded as contra revenue were
approximately 8% and 6% of our gross revenue for fiscal years 2011 and 2010, respectively.
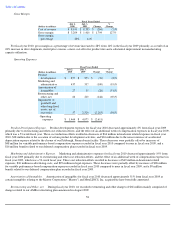
Gross Margin
54
Fiscal Years Ended
(In millions, except percentages and
ASPs)
July 1,
2011
July 2,
2010
July 3,
2009
Net Revenue
$
10,971
$
11,395
$
9,805
Unit Shipments:
Enterprise
29.1
25.4
22.3
Client Compute
132.3
135.0
114.9
Client Non
-
Compute
37.6
32.8
26.6
Total Units Shipped
199.0
193.2
163.8
ASPs (per unit)
$
54
$
58
$
59
Revenues by Channel (%)
OEM
69
%
71
%
64
%
Distributors
22
%
21
%
27
%
Retail
9
%
8
%
9
%
Revenues by Geography (%)
Americas
29
%
26
%
28
%
EMEA
20
%
22
%
27
%
Asia Pacific
51
%
52
%
45
%
Fiscal Years Ended
(Dollars in millions)
July 1,
2011
July 2,
2010
Change
%
Change
Revenue
$
10,971
$
11,395
$
(424
)
(4
)%
Fiscal Years Ended
(Dollars in millions)
July 1,
2011
July 2,
2010
Change
%
Change
Cost of revenue
$
8,825
$
8,191
$
634
8
%
Gross margin
$
2,146
$
3,204
$
(1,058
)
(33
)%
Gross margin
percentage
20
%
28
%