Seagate 2010 Annual Report Download - page 45
Download and view the complete annual report
Please find page 45 of the 2010 Seagate annual report below. You can navigate through the pages in the report by either clicking on the pages listed below, or by using the keyword search tool below to find specific information within the annual report.-
 1
1 -
2
-
3
-
4
-
5
-
6
-
7
-
8
-
9
-
10
-
11
-
12
-
13
-
14
-
15
-
16
-
17
-
18
-
19
-
20
-
21
-
22
-
23
-
24
-
25
-
26
-
27
-
28
-
29
-
30
-
31
-
32
-
33
-
34
-
 35
35 -
 36
36 -
 37
37 -
 38
38 -
 39
39 -
 40
40 -
 41
41 -
 42
42 -
 43
43 -
 44
44 -
 45
45 -
 46
46 -
 47
47 -
 48
48 -
 49
49 -
 50
50 -
 51
51 -
 52
52 -
 53
53 -
 54
54 -
 55
55 -
56
-
57
-
58
-
59
-
60
-
61
-
62
-
63
-
64
-
65
-
66
-
67
-
68
-
69
-
70
-
71
-
72
-
73
-
74
-
75
-
76
-
77
-
78
-
79
-
80
-
81
-
82
-
83
-
84
-
85
-
86
-
87
-
88
-
89
-
90
-
91
-
92
-
93
-
94
-
95
-
96
-
97
-
98
-
99
-
100
-
101
-
102
-
103
-
104
-
105
-
106
-
107
-
108
-
109
-
110
-
111
-
112
-
113
-
114
-
115
-
116
-
117
-
118
-
119
-
120
-
121
-
122
-
123
-
124
-
125
-
126
-
127
-
128
-
129
-
130
-
131
-
132
-
133
-
134
-
135
-
136
-
137
-
138
-
139
-
140
-
141
-
142
-
143
-
144
-
145
-
146
-
147
-
148
-
149
-
150
-
151
-
152
-
153
-
154
-
155
-
156
-
157
-
158
-
159
-
160
-
161
-
162
-
163
-
164
-
165
-
166
-
167
-
168
-
169
-
170
-
171
-
172
-
173
-
174
-
175
-
176
-
177
-
178
-
179
-
180
-
181
-
182
-
183
-
184
-
185
-
186
-
187
-
188
-
189
-
190
-
191
-
192
-
193
-
194
-
195
-
196
-
197
-
198
-
199
-
200
-
201
-
202
-
203
-
204
-
205
-
206
-
207
-
208
-
209
-
210
-
211
-
212
-
213
-
214
-
215
-
216
-
217
-
218
-
219
-
220
-
221
-
222
-
223
-
224
-
225
-
226
-
227
-
228
-
229
-
230
-
231
-
232
-
233
-
234
-
235
-
236
-
237
-
238
-
239
-
240
-
241
-
242
-
243
-
244
-
245
-
246
-
247
-
248
-
249
-
250
-
251
-
252
-
253
-
254
-
255
-
256
-
257
-
258
-
259
-
260
-
261
-
262
-
263
-
264
-
265
-
266
-
267
-
268
-
269
-
270
-
271
-
272
-
273
-
274
-
275
-
276
-
277
-
278
-
279
-
280
-
281
-
282
-
283
-
284
-
285
 |
 |

Table of Contents
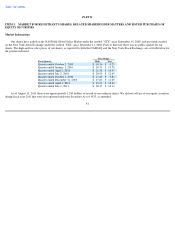
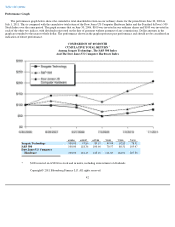
Performance Graph
The performance graph below shows the cumulative total shareholder return on our ordinary shares for the period from June 30, 2006 to
July 1, 2011. This is compared with the cumulative total return of the Dow Jones US Computer Hardware Index and the Standard & Poor's 500
Stock Index over the same period. The graph assumes that on June 30, 2006, $100 was invested in our ordinary shares and $100 was invested in
each of the other two indices, with dividends reinvested on the date of payment without payment of any commissions. Dollar amounts in the
graph are rounded to the nearest whole dollar. The performance shown in the graph represents past performance and should not be considered an
indication of future performance.
COMPARISON OF 60 MONTH
CUMULATIVE TOTAL RETURN
*
Among Seagate Technology, The S&P 500 Index
And The Dow Jones US Computer Hardware Index
42
6/30/06
6/29/07
6/27/08
7/3/09
7/2/10
7/1/11
Seagate Technology
100.00
97.80
89.15
49.04
62.83
78.91
S&P 500
100.00
118.36
100.64
70.57
80.51
105.47
Dow Jones US Computer
Hardware
100.00
142.15
143.10
114.03
162.06
207.30
* $100 invested on 6/30/06 in stock and in index, including reinvestment of dividends.
Copyright
©
2011 Bloomberg Finance L.P. All rights reserved.