Seagate 2010 Annual Report Download - page 49
Download and view the complete annual report
Please find page 49 of the 2010 Seagate annual report below. You can navigate through the pages in the report by either clicking on the pages listed below, or by using the keyword search tool below to find specific information within the annual report.-
 1
1 -
2
-
3
-
4
-
5
-
6
-
7
-
8
-
9
-
10
-
11
-
12
-
13
-
14
-
15
-
16
-
17
-
18
-
19
-
20
-
21
-
22
-
23
-
24
-
25
-
26
-
27
-
28
-
29
-
30
-
31
-
32
-
33
-
34
-
35
-
36
-
37
-
38
-
 39
39 -
 40
40 -
 41
41 -
 42
42 -
 43
43 -
 44
44 -
 45
45 -
 46
46 -
 47
47 -
 48
48 -
 49
49 -
 50
50 -
 51
51 -
 52
52 -
 53
53 -
 54
54 -
 55
55 -
 56
56 -
 57
57 -
 58
58 -
 59
59 -
60
-
61
-
62
-
63
-
64
-
65
-
66
-
67
-
68
-
69
-
70
-
71
-
72
-
73
-
74
-
75
-
76
-
77
-
78
-
79
-
80
-
81
-
82
-
83
-
84
-
85
-
86
-
87
-
88
-
89
-
90
-
91
-
92
-
93
-
94
-
95
-
96
-
97
-
98
-
99
-
100
-
101
-
102
-
103
-
104
-
105
-
106
-
107
-
108
-
109
-
110
-
111
-
112
-
113
-
114
-
115
-
116
-
117
-
118
-
119
-
120
-
121
-
122
-
123
-
124
-
125
-
126
-
127
-
128
-
129
-
130
-
131
-
132
-
133
-
134
-
135
-
136
-
137
-
138
-
139
-
140
-
141
-
142
-
143
-
144
-
145
-
146
-
147
-
148
-
149
-
150
-
151
-
152
-
153
-
154
-
155
-
156
-
157
-
158
-
159
-
160
-
161
-
162
-
163
-
164
-
165
-
166
-
167
-
168
-
169
-
170
-
171
-
172
-
173
-
174
-
175
-
176
-
177
-
178
-
179
-
180
-
181
-
182
-
183
-
184
-
185
-
186
-
187
-
188
-
189
-
190
-
191
-
192
-
193
-
194
-
195
-
196
-
197
-
198
-
199
-
200
-
201
-
202
-
203
-
204
-
205
-
206
-
207
-
208
-
209
-
210
-
211
-
212
-
213
-
214
-
215
-
216
-
217
-
218
-
219
-
220
-
221
-
222
-
223
-
224
-
225
-
226
-
227
-
228
-
229
-
230
-
231
-
232
-
233
-
234
-
235
-
236
-
237
-
238
-
239
-
240
-
241
-
242
-
243
-
244
-
245
-
246
-
247
-
248
-
249
-
250
-
251
-
252
-
253
-
254
-
255
-
256
-
257
-
258
-
259
-
260
-
261
-
262
-
263
-
264
-
265
-
266
-
267
-
268
-
269
-
270
-
271
-
272
-
273
-
274
-
275
-
276
-
277
-
278
-
279
-
280
-
281
-
282
-
283
-
284
-
285
 |
 |

Table of Contents
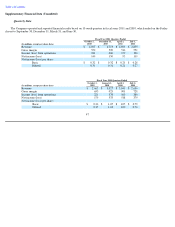
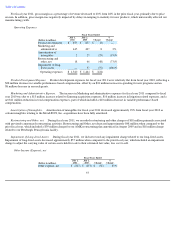
ITEM 6. SELECTED FINANCIAL DATA
The following selected consolidated financial data set forth below is not necessarily indicative of results of future operations, and should be
read in conjunction with "Item 7. Management's Discussion and Analysis of Financial Condition and Results of Operations" and the
Consolidated Financial Statements and related notes thereto included in "Item 8. Financial Statements and Supplementary Data" of this Annual
Report on Form 10-K, which are incorporated herein by reference, to fully understand factors that may affect the comparability of the
information presented below.
The Consolidated Statements of Operations data for the years ended July 1, 2011, July 2, 2010 and July 3, 2009 and the Consolidated
Balance Sheet data at July 1, 2011 and July 2, 2010, are derived from our audited Consolidated Financial Statements appearing elsewhere in this
Annual Report on Form 10-K. The Consolidated Statements of Operations data for the years ended June 27, 2008 and June 29, 2007, and the
Consolidated Balance Sheet data at July 3, 2009, June 27, 2008 and June 29, 2007, are derived from our audited Consolidated Financial
Statements that are not included in this Annual Report on Form 10-K.
46
Fiscal Years Ended
(Dollars in millions, except per share data)
July 1,
2011
July 2,
2010
July 3,
2009
(1)
June 27,
2008
June 29,
2007
Revenue
$
10,971
$
11,395
$
9,805
$
12,708
$
11,360
Gross margin
2,146
3,204
1,410
3,205
2,185
Income (loss) from operations
806
1,740
(2,665
)
1,376
614
Net income (loss)
511
1,609
(3,125
)
1,251
933
Total assets
9,225
8,247
7,087
10,150
9,502
Total debt
3,512
2,502
2,697
1,978
2,000
Shareholders' equity
$
2,463
$
2,724
$
1,554
$
4,667
$
4,829
Net income (loss) per share:
Basic
$
1.13
$
3.28
$
(6.40
)
$
2.44
$
1.67
Diluted
1.09
3.14
(6.40
)
2.33
1.59
Number of shares used in per share
computations:
Basic
451
491
488
512
558
Diluted
467
514
488
538
587
Cash dividends declared per share
$
0.18
$
—
$
0.27
$
0.42
$
0.38
(1)
Includes the effect of a $2.3 billion impairment of goodwill and other long
-
lived assets.